
 Last week I looked into the theory that January and February are Hollywood ‘dump months’ when the studios rush out all the films they have to release but don’t really want to. The article led to a number of people asking me about the cyclical nature of movie release patterns, and so I thought I would take a look today.
I studied all of the films released in the US in the past five years which grossed at least $1.
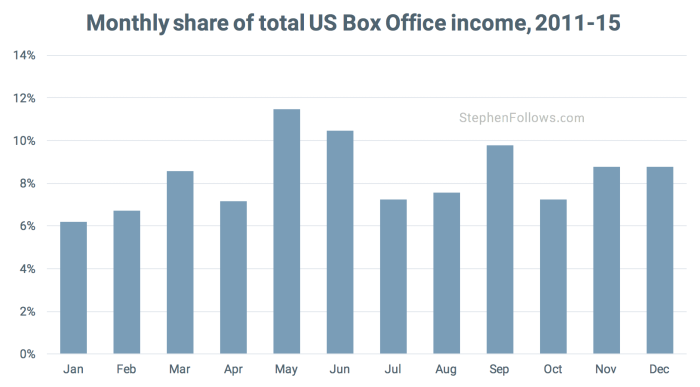
Fluctuations in cinema attendance
The biggest months for cinema attendance are normally the ones leading into the summer (May and June) and the start of autumn (September). Over the past five years, May is the month with the largest box office total, accounting for 11.5% of the annual income.
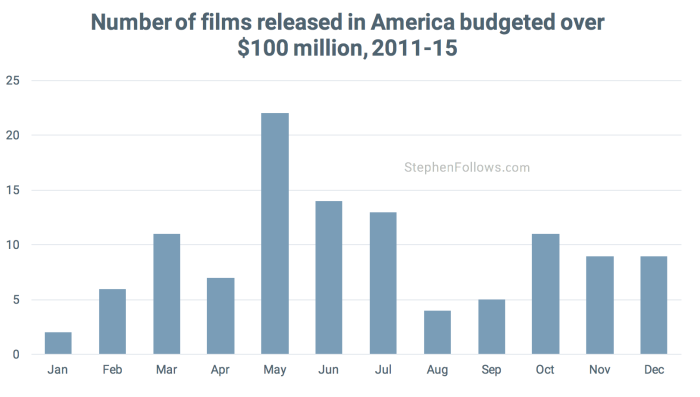
Blockbuster season
 One the main reasons why May is the biggest month is that’s when the biggest Hollywood movies are typically released. These are known as ‘tentpole’ movies as they are the main pillar of Hollywood studios’ annual release strategies. These movies are expected to bring in the big bucks, and provide a large proportion of the Studio’s revenue. They also tend to command slightly higher ticket prices, thanks to cinemas charging more for IMAX and 3D releases. In addition, recently UK cinemas have begun adding a ‘blockbuster tax’ of around £1 for tickets to the biggest hollywood movies, even if they’re presented in standard 2D. (I tracked this here stephenfollows.com/average-cost-of-a-cinema-ticket).
Between 2011 and 2015, nearly half (43%) of the films budgeted over $100 million were released in May, June and July. May was the biggest month in each of the past four years (in 2012 it shared the honour with June and July) for the biggest Hollywood movies.
Twelve months of releases
 Other than blockbusters in May, are there any other patterns to movie releases? Yes, it turns out that each genre has its own ‘hot spots’ and fallow periods. Let’s take a stroll through the year looking at a few of the bigger genres as we go.
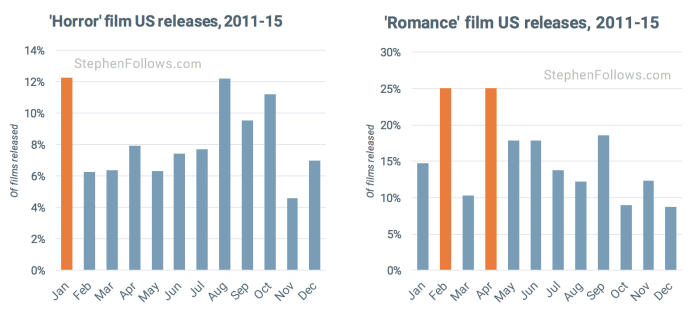
We will start in January which, as we already know from last week, is one of Hollywood’s ‘dump months’. Perhaps surprisingly, January is the most popular month for horror releases, just beating August by a few films. I think most people (myself included) would assume that October was the busiest period for horror films, due to Halloween.
In February, romance rules, with a flurry of romantic films released in time for Valentine’s Day. There is a second blush of soppy films two months later, meaning that February and April share top place for romantic releases.
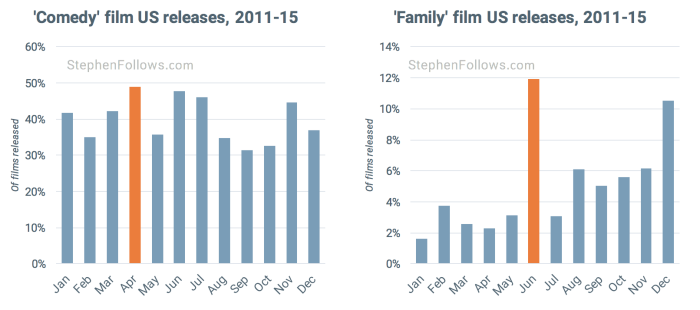
Comedy films seem to be slightly more evergreen compared with other genres, with their April peak only just above most other months of the year. This contrasts sharply with family films, which bloom at just two points in the year – at the start of the summer and winter holidays.
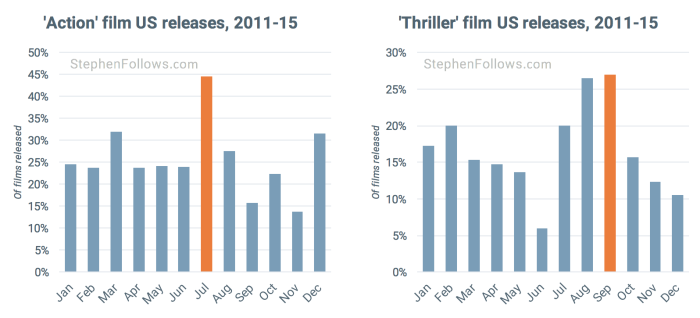
This data shows the first day of the US ‘wide’ release, so many of June’s family films will still be in cinemas over the summer. They are joined by an influx of action movies, followed soon after by thrillers. One could argue that action films are just thrillers with a bigger budget so it seems to fit the pattern of decreasing budgets as we move away from May’s blockbuster peak.
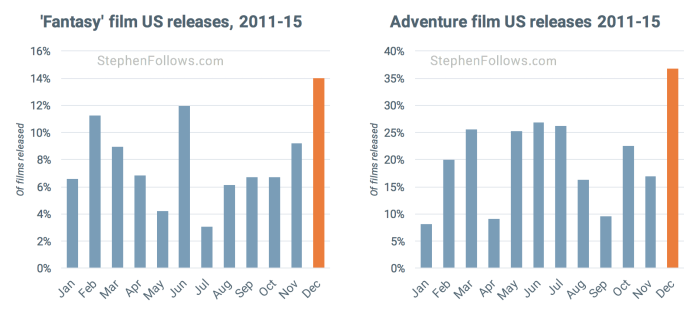
As shown in the horror graph earlier, scary films make a comeback as the year moves on, but it’s the fantasy and adventure films which rule the last few months.
And then the whole thing rolls around again… Watch. Remake. Repeat.
Notes on Hollywood’s movie release pattern
Today’s dataset was made up of all films which were released in US cinemas between 1st January 2011 and 31st December 2015, and which grossed at least $1 at the US box office (according to IMDb’s Box Office figures). This came to 1,175 films in total.
As the film industry is global and complex, there is no such thing as one definite release date. Last week, I discussed how release dates differ, and this is how I classified the release research today. (The short story is that I used the first US ‘wide’ release date).


Comments
More amazing work. Thank you.
Nice post. And it is very clear and informative.
This information is really valuable, thank you.
It explains why traffic to my site experiences dips and highs.
Thanks Stephen- catching up on my reading but this among with so many are full of interesting insights.
Interesting post, thank you. But there is no mention of drama. What’s the rationale for this omission?
Interested in why September accounts for such a high percentage, when it’s not typically thought to be a strong month for movies.