How I Compiled the Genre Statistics

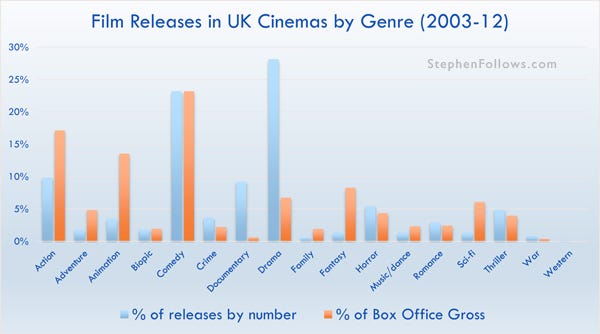
A few days ago I published an article on the genres of films which filmmakers make and which audiences watch in the cinema and at home. The results have sparked some interesting debates on Facebook and I've been contacted by a few people asking for more details. Much of the conversation is around the evidence that filmmakers make Dramas but audiences want to watch Comedies. Drama accounts for one in four of the films made in the UK but Dramas only accounts for 7% of the UK box office. Comedy is consistently the highest grossing genre in the cinema, on rental and on purchased copies. Broadly speaking, the debate seems to be between filmmakers (who are dubious of these findings) and film sales professionals (who say that these figures chime with their experiences). It's not my place to pick sides, but I am more than happy to open up the process by which I discovered these results.
Start with the raw data...

I came to the conclusion in question by comparing two sets of data - films made in the UK and film show in UK cinemas. The raw data came from going through ten years worth of the BFI Statistical Yearbook. The Yearbook is a wonderful resource, started by the UK Film Council and now continued by the BFI, and gives an annual snapshot of the UK Film Industry. To find the genre figures I needed to look at both Production and Exhibition data from each Yearbook. Box office figures are published in a similar fashion.
... collate into one document...

I collated these into two Excel spreadsheets, and started to crunch the numbers. For the box office figures I cross-referenced the takings of each genre with the total box office revenue for that year, in order to produce the percentages. You can download this data here...
... and then analyse

I chose to publish box office percentages instead of the hard figures in pounds in order to remove the effect of inflation and the overall growth in ticket sales over this period. The one negative effect of this approach is that an abnormally well-performing film will suppress the receipts for other genres. For example, in an average year Biopics usually about for around 1% of the overall box office but in 2009 The King's Speech pushed that up to 5%, thereby stealing some percentage points from Comedy, Action and every other genre. Nonetheless I felt that this was a minor price worth paying in order to be able to collate a decade of data in one comparable chart.

Repeat

Each of the graphs I publish come from slightly different sources/methods and I use different analytical techniques to discover the results. In all cases, I don't go in with an agenda; I collect all the data I can and then see what the results reveal. In some cases I don't personally like the results, such as the data on recoupment and distribution for smaller independent films. However, this blog is designed to be a platform for how the UK film world actually works, not how I'd like the world to be. If it was then there would be more pictures of kittens.
The end result
And here are the final two graphs...


