Are cinema box office takings rising or falling?

In the last few weeks, there have been a number of press articles discussing the state of the theatrical box office. Some suggest that the picture is rosy ("Cinema box office breaks record third year in a row") while others claim it's in a decline ("2017 was the worst year for movie ticket sales in over two decades").
I have been contacted by a few readers who asked about these seemingly-conflicting headlines and wanted to know which picture was more accurate.
The short story is that this is no big mystery - the articles are referring to different countries and sometimes different ways of measuring cinema attendance. In the case of the articles mentioned above, the first is reporting total box office gross in the UK while the latter is looking at the number of tickets sold in the US.
But it's fascinating to understand how the cinema industry is growing or shrinking around the world, so let's see if we can unpick the numbers and get a clearer sense of what's happening.
The big picture for motion pictures
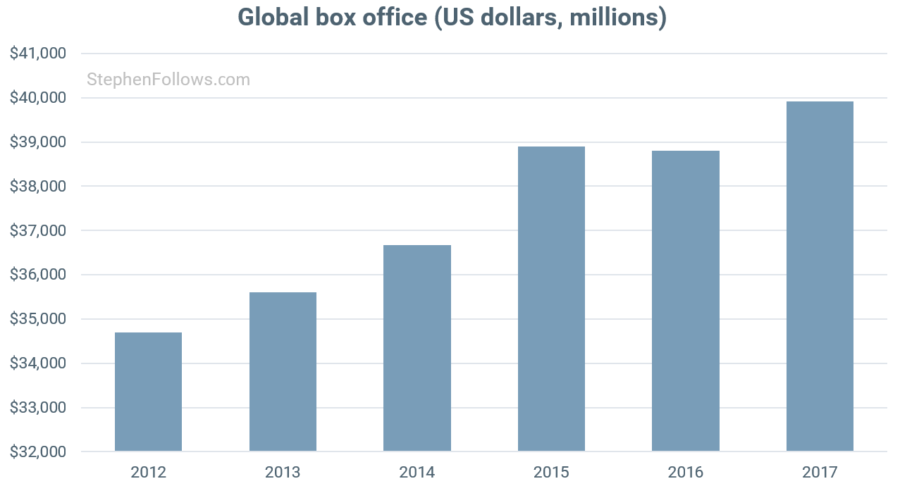
Let's start with the global picture. The term 'box office gross' refers to the total amount of money collected by cinemas in the sale of cinema tickets, before any deductions or dispersions (such as tax, or the money going back to the filmmakers).
In the past six years, the global box office has grown by 15%, from $34.7 billion in 2012 to $39.9 billion in 2017.
Splitting the world in two
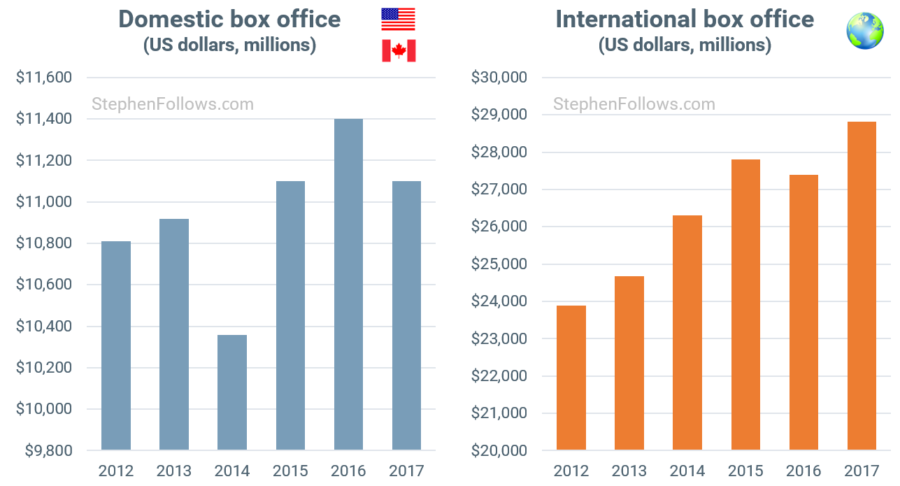
The 'domestic box office' refers to money grossed at cinemas in the United States and Canada, and the term 'international box office' refers to the rest of the world. The domestic box office accounts for an ever-smaller share of the global box office. In 2012, domestic takings made up 31% of the global gross, whereas in 2017 it was down to 28%.
Most recently, the domestic box office shrunk slightly, from £11.4 billion in 2016 to $11.1 billion in 2017, although over the past six years it has grown by 2.7%.
Eagle-eyed readers will have already calculated that if the domestic box office grew by under 3% and the global box office grew by 15% then the international box office must be growing by a larger amount. Indeed it is, with a six-year growth of 21% since 2012.
Let's have a look at some other major international film markets to see which box offices are rising and which are waning...
The international winners
The biggest growth has been in China, where their box office has increased by 229% between 2012 and 2016. This staggering growth dwarfs the success of all other major film territories and is a major reason for the overall international growth we saw above.
Another fast-growing market is that of Russia, whose growth over the same period was 44%.

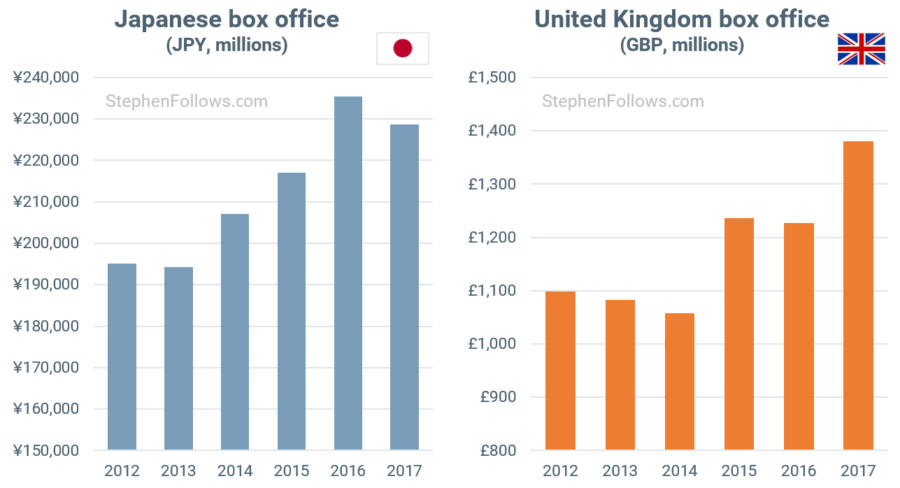
Two other fast-growing countries are Japan (17% growth 2012-17) and the United Kingdom (26%).
Not all box offices are growing
So far, we have looked at countries showing a double or triple-digit growth but not all are so fortunate.
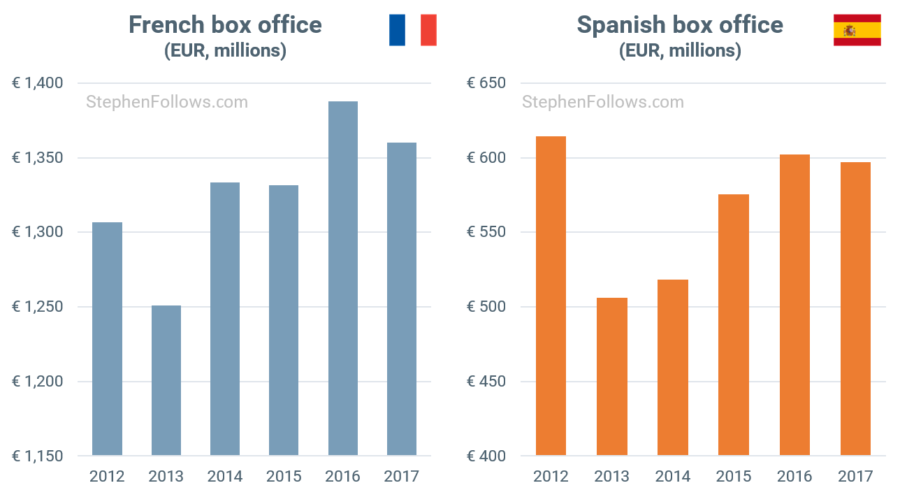
The French box office grew by 4% between 2012 and 2017. The vast majority of that rise can be attributed to inflation, which was around 3% in the Eurozone over that period. The Spanish box office has actually fallen since 2012, by almost 3%.
Overall change between countries
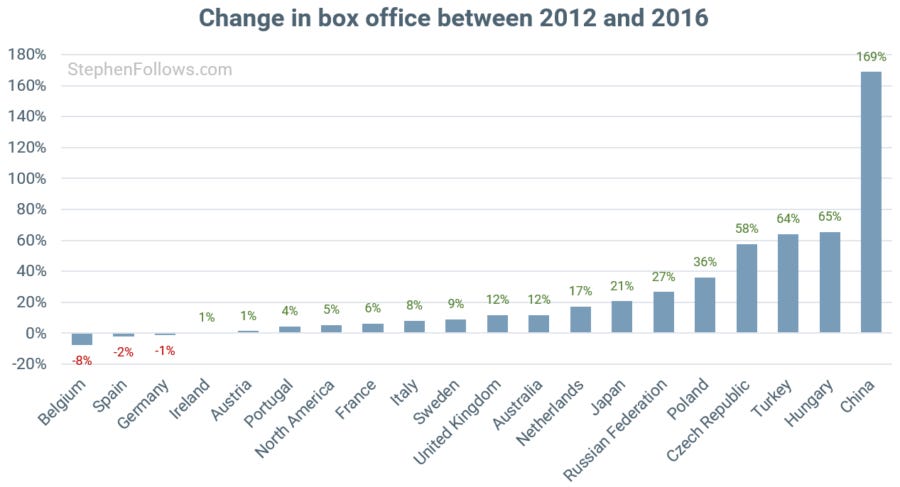
I want to quote the topline figure for as many countries as I can, but it's too early in the year to be able to get 2017 box office figures for many countries. Therefore, the chart below looks at the change between 2012 and 2016. This five-year period is one year shorter than the figures quoted in the other charts in this article, hence why the changes are slightly different.
Is the box office figure showing the full story?
Quoting the total box office gross is a quick and simple method to get a sense of changes to a country's cinema-going population. However, it's not without its flaws. Inflation, ticket prices and currency fluctuations (when looking at the global picture in US dollars) can all have an invisible effect.
Therefore I wanted to quickly touch on a few other things we can measure when taking a country's cinema pulse.
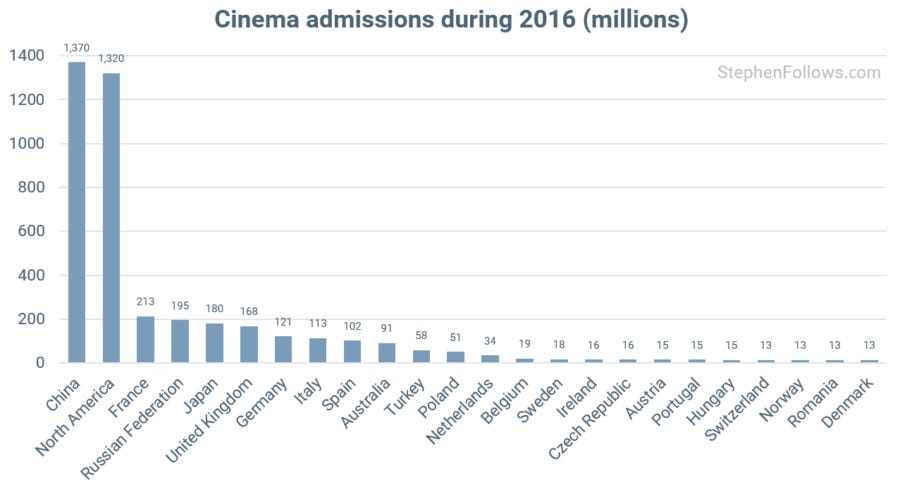
We can look at the total number of cinema tickets purchased over a year. This puts China at the top, with 1.4 billion tickets purchased in 2016, followed closely by North America at 1.3 billion.
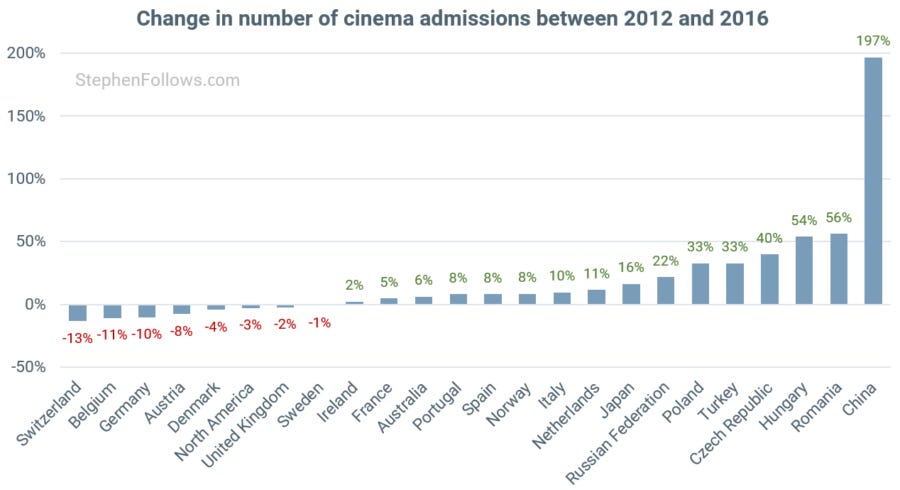
If we chart the change in admissions over time then we can gain some insight into the box office figures we noted earlier. No longer is the UK showing growth, but rather a slight fall over the five-year period between 2012 and 2016. This means its box office growth was down to a rise in cinema ticket prices and inflation.
Frequency and cost of cinema-going
As a final offering for today, it's possible for us to use the data we have already looked at to shed a little more light on changes over time.
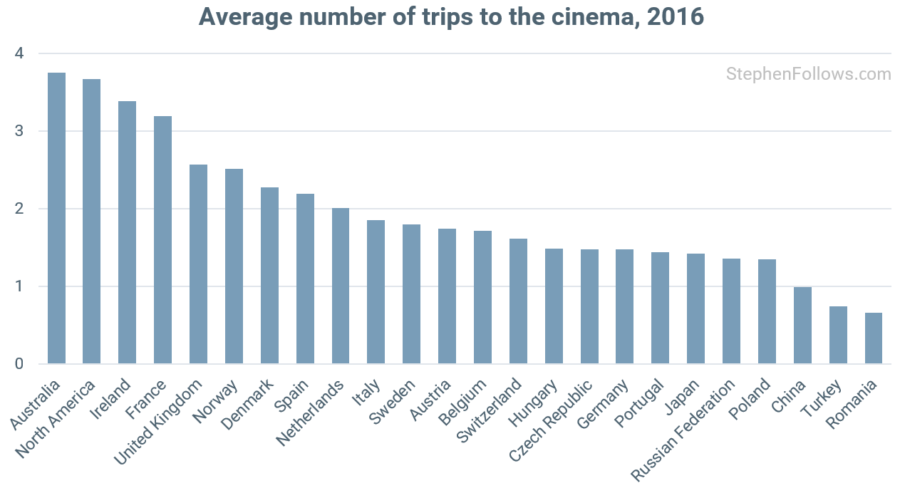
For example, by dividing a country's cinema admissions by its population, we can get a sense of how many trips to the cinema people make. Australia is out in front of this pack, with an average of 3.8 trips per inhabitant in 2016.
We can also divide a country's box office gross by the number of admissions, thereby giving us an average for the cost of a cinema ticket.
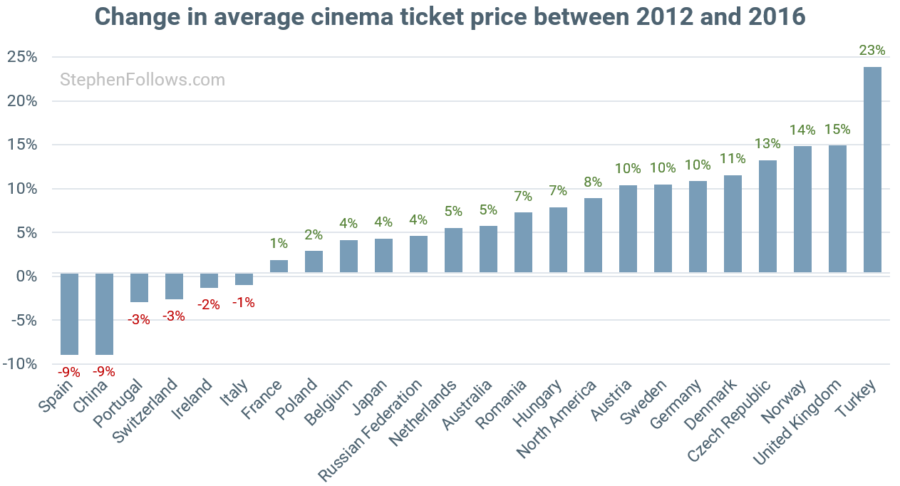
In the past, I have complained about the cinema industry using this method of calculation as it dramatically underplays the true cost of a cinema ticket. It doesn't take into account the fact that many groups receive discounts (such as children, teenagers, the elderly and the military) nor does it account for free cinema tickets and offers.
In a previous research project, I discovered that the average price of a standard 2D off-peak cinema ticket in the UK was £9.84 – way above the industry ‘official’ average of £6.72.
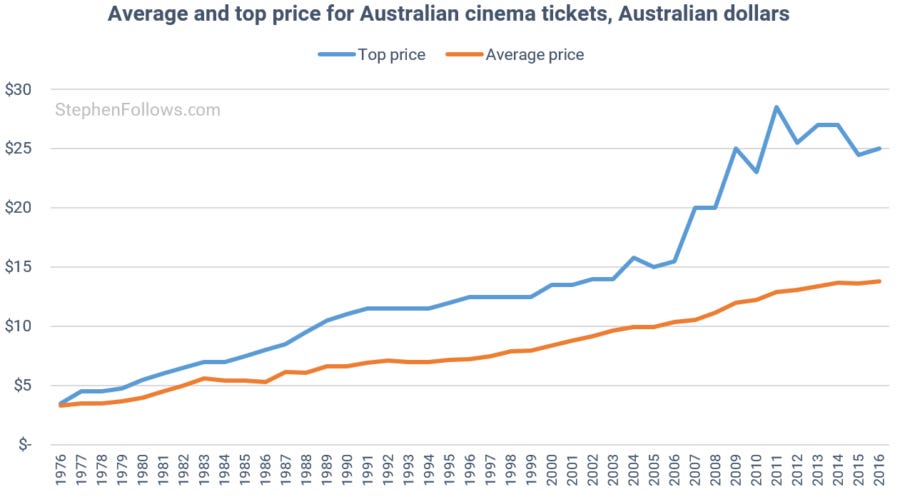
Screen Australia account for this in an ingenious way, namely tracking both the average price of a cinema ticket and also the top price they can find for a standard cinema ticket (based on periodical spot checks conducted by the Australian Theatre Checking Service throughout the year).
As you can see below, not only is the top price much higher than the average, but it's rising at a much quicker rate.
Notes
Data for today's article came from a whole host of places including the International Union of Cinemas, comScore, Cinema Exhibitors Association, British Film Institute, European Audiovisual Observatory, SPF Economie, Cinedata, La Fédération des Cinémas de Belgique, Belgian Entertainment Association, National Film Center, Cyprus Ministry of Education and Culture, Czech State Cinematography Fund, FFA, Statistics Denmark, Danish Film Institute, Estonian Film Institute, ICAA, Finnish Film Foundation, Le Centre national du cinéma et de l’image animée, Cinema Advertisers Association, Greek Film Center, Croatian Audiovisual Center, National Film Office, MEDIA LIVE, Irish Film Board, Cinetel, SIAE, ANICA, Lithuanian Film Center, MEDIA Salles, MPAA, National Film Center, National Statistics Office, Netherlands Film Festival, MaccsBox, Film Distributeurs Nederland, Polish Film Institute, boxoffice.pl, Cinema E Audiovisual Portugues, Centru National al Cinematografiei, Screen Australia, Swedish Film Institute, Slovenian Film Institute, Únia filmových distribútorov and Slovak Film Institute.
There is always some degree of generalisation and dumbing down with data such as this. For example, I struggled to take account of inflation in a meaningful way. When looking at one country it's possible to find an average annual rate of inflation, although if it changed dramatically throughout the year then even the annual rate would not be quite accurate.
Even an annual average inflation rate can't be used for the global picture as inflation can differ considerably between countries. In addition, wherever possible I have tried to look at box office data in the country's original currency but I had to use US dollar conversions for the global box office, meaning currency fluctuations may be having some unseen effect on the totals.
A few of the more recent figures are estimates. Wherever possible, I used figures from the official national body of the country in question, but in the case of some 2017 box office figures, I was forced to rely on professional estimates as reported in the film trade press.
I have not included countries for which I could not find reliable data, such as India. This means that each time I mention that a country is 'top', I mean top of the countries in the chart provided. Apart from China - that's top of everything, always and everywhere.
Epilogue
As I'm sure you can tell by now, this is a huge topic and one which demands much more study and data than I can give it here. Looking at the topline figures can only ever give us an rough indication of what's happening in a country but hopefully I've given you some context for when you next see joyous or gloomy press headlines about box office performance.


