The statistics behind film crowdfunding: Part 1

Over the past few months I've been running a number of research projects into film crowdfunding and now I'm ready to start sharing what I've found.
The research has two outcomes. Firstly, blog articles sharing the results of my data research into film projects on Kickstarter, Indiegogo and other crowdfunding platforms. It's going to take a few weeks to publish it all as there's so much but eventually it will all end up on here for free.
Secondly, a short online course called 'A Crash Course In Crowdfunding for Filmmakers'. This is everything you need to know to get started running a crowdfunding campaign for your film.
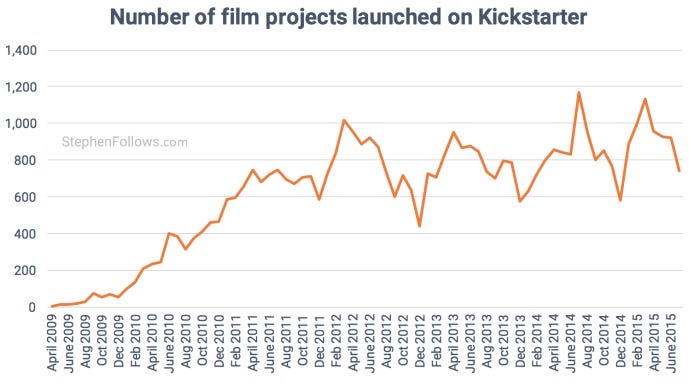
Up first, here are the top-line stats on the 47,809 film crowdfunding campaigns launched on Kickstarter between their inception in April 2009 and October 2015. In summary...
Film projects on Kickstarter have an average success rate of 43%
The success rate is dropping, very slowly
Short films have the highest success rate; 59% of them reach their goal
The busiest months for new film projects are March, April and June
Tuesday is the most popular day for new projects and Sunday is the slowest
Projects with deadlines on a Sunday have lower success rates than the rest of the week
The most popular time to launch a film project on Kickstarter was just after lunch, at 2pm
Documentaries used to be almost half of Kickstarter film projects but now they are a quarter
In January 2010, 98% of film Kickstarter projects were based in America
By January 2015 that had dropped to 71%
15% of all Kickstarter film projects are based in LA
How many film crowdfunding projects are on Kickstarter?
Between April 2009 and the start of October 2015, 47,809 film crowdfunding projects were launched on Kickstarter. Of those 24,943 were successful in reaching their target goal and 18,504 failed. That's an overall success rate of 42.6%. A further 4,301 projects were cancelled by the creators and 61 were suspended by Kickstarter.

The slowest months for new projects are December, August and November and the busiest are March, April and June. To work this out, I couldn't just look at the number of film projects released in each calendar year, because Kickstarter has been growing year on year. This would have led to an under-representation of the months early in the calendar year and an over-representation of those at the end. Therefore, I looked at the number of projects launched each month as a percentage of those launched in the previous 12 months (up to and including that month).

Tuesday is the most popular day for new projects and Sunday is the slowest.

Finally, the most popular time to launch a film crowdfunding project on Kickstarter was just after lunch, around 2pm.

N.B. These are local times, adjusted for time zones. I excluded projects for which I could not work out a reasonable time zone, such as Antarctica which has more official timezones than Kickstarter film projects (ten time zones and six projects).
What kinds of film projects are crowdfunded on Kickstarter?
In 2009, documentaries made up almost 43% of all projects on Kickstarter, but in the first nine months of 2015 that had dropped to 25%.

Kickstarter included new sub-categories in 2014, so the data below shows projects launched between January 2004 and October 2015. Short films account for 15% of film crowdfunded projects on Kickstarter, followed by webseries (10%), comedies (7%) and dramas (6.5%).

Where are they based?
Historically, Kickstarter has been very US-focused, however in recent years they've made a number of efforts to expand their user base. (In fact, they're hiring for a Director of International Growth and Engagement right now). We can see this increasing international focus in the location of where film projects are based. At the start of 2010, 98% of film projects were based in America but by the start of 2015 that had dropped to 71%.

Within the US, California was the state with the most projects (28.4% of all film crowdfunding campaigns), followed by New York (12.6%), Texas (4.0%), Florida (3.6%) and Illinois (3.1%). The remaining US states made up 36.2% of Kickstarter film projects.
We see even more clustering when we break it down by city - 15% of all Kickstarter film projects were based in LA.

Not only are a large number of projects based in LA, they also collect a disproportionate amount of the money pledge. 24% of all the money pledged to Kickstarter film crowdfunding campaigns between April 2009 and October 2015 went to projects based in LA.

What percentage of film crowdfunding projects are successful?
Across all film projects, 42.6% reach or over-reach their goal (see my notes at the bottom of this article for methodology for calculating this rate). Over time the success rate for film projects has been dropping, but not by much when you consider that there are many more projects competing. In August 2009, 46% of film projects reached their goal, whereas by August 2015 that had fallen to 32% (Aug 2015 saw 20 times as many projects being launched compared to Aug 2009).

Over the next few weeks, I'm going to be sharing more data on the success rate of film crowdfunding projects, but today we're just going to look at how success rates differ for genres and day of launch.
Short films have the highest success rate with almost 59% of them reaching their goal. This is likely related to the fact that short films also ask for the lowest average goal (See next week's article for more info on this).

Film projects where their deadline falls on a Sunday have lower success rates - 40.5% are successful, compared with an average of 43% for all the other days of the week.

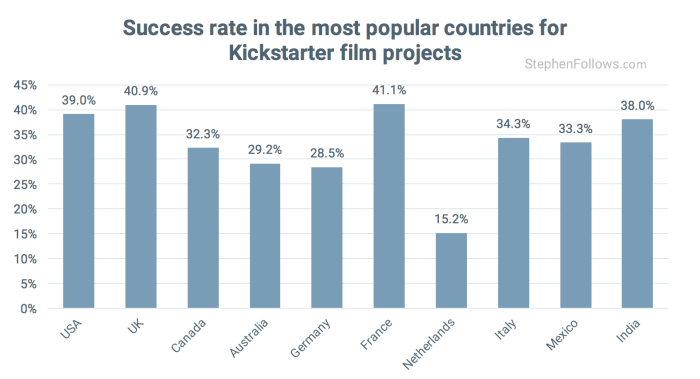
And if we look at the ten countries which have the highest number of film projects, we can see that the French lead the pack, with a 41.1% success rate and the Dutch have the lowest, with just 17 of their 112 film projects reaching their goal (15.2%).

Data and methodology
I looked at all film crowdfunding campaigns on Kickstarter launched between the start of Kickstarter in April 2009 (the first film project I have was launched on 29 April 2009) and 2nd October 2015. I excluded any projects still live when I collected the last of my data.

It's certainly possible that I've missed a few projects. I have cross-referenced my data with Kickstarter's live data at kickstarter.com/help/stats and the Wayback Internet Archive to look at the 'live' data for 297 points in time between June 2012 and September 2015. I have data on 96.9% of the film projects over the studied period.
When talking about the number of projects launched I included all of them, no matter what the outcome was. However, when discussing campaign success rates I looked at the number which were successfully funded out of those projects that had reached the final deadline of their campaign, excluding campaigns which were suspended by Kickstarter or cancelled by the creator. This means that my formula was "successful campaigns / (successful campaigns + failed campaigns)".
This is very similar but not identical to how Kickstarter calculate success rates on their stats page. I do not know if a suspended or cancelled campaign reached their deadline before being closed - only that the project was not either 'successful' or 'failed'. Here are some numbers to explain the different methods of calculating the success rate...
There were 47,809 film projects in my research dataset. Of those, 24,943 were successful, 18,504 failed, 4,301 were cancelled and 61 were suspended.
I have chosen to take the number of successful projects over the combined figure of those successful and failed. i.e. 24,943 / 43,447 = 42.6%
I could have chosen to take the number of successful projects over the total projects launch. i.e. 24,943 / 47,809 = 38.7%.
Kickstarter's current published success rate for film projects is 37.6%. The difference between this and the above figure is because they are including slightly more projects than I have, their figure is up to date whereas my data ends in October 2015 and because they know which cancelled and suspended projects reached the deadline date.
Epilogue
I'm really excited about publishing this data as it's been a long-running project of mine. It took a while to gather the data and then to actually crunch it but now that's done I hope that this can be of use to filmmakers everywhere.
Next week we're going to look at money - the goals the filmmakers are trying to raise and how much is actually given by backers.


