A 2013 study in the journal Pediatrics concluded that gun violence in PG-13 films had more than tripled since 1985, and that recent PG-13 movies actually had more gun violence than R-rated ones.
This caused quite a stir at the time and seemed to confirm everything some parents worried about when it comes to cinema and violence. However, after researching the topic, I don’t think what people took away from it reflects what's really happening on-screen.
Today’s PG-13 films are not more violent than the R-rated films of the 1980s. They contain a little less gunfire (about four-fifths as much), and they are nowhere near as violent.
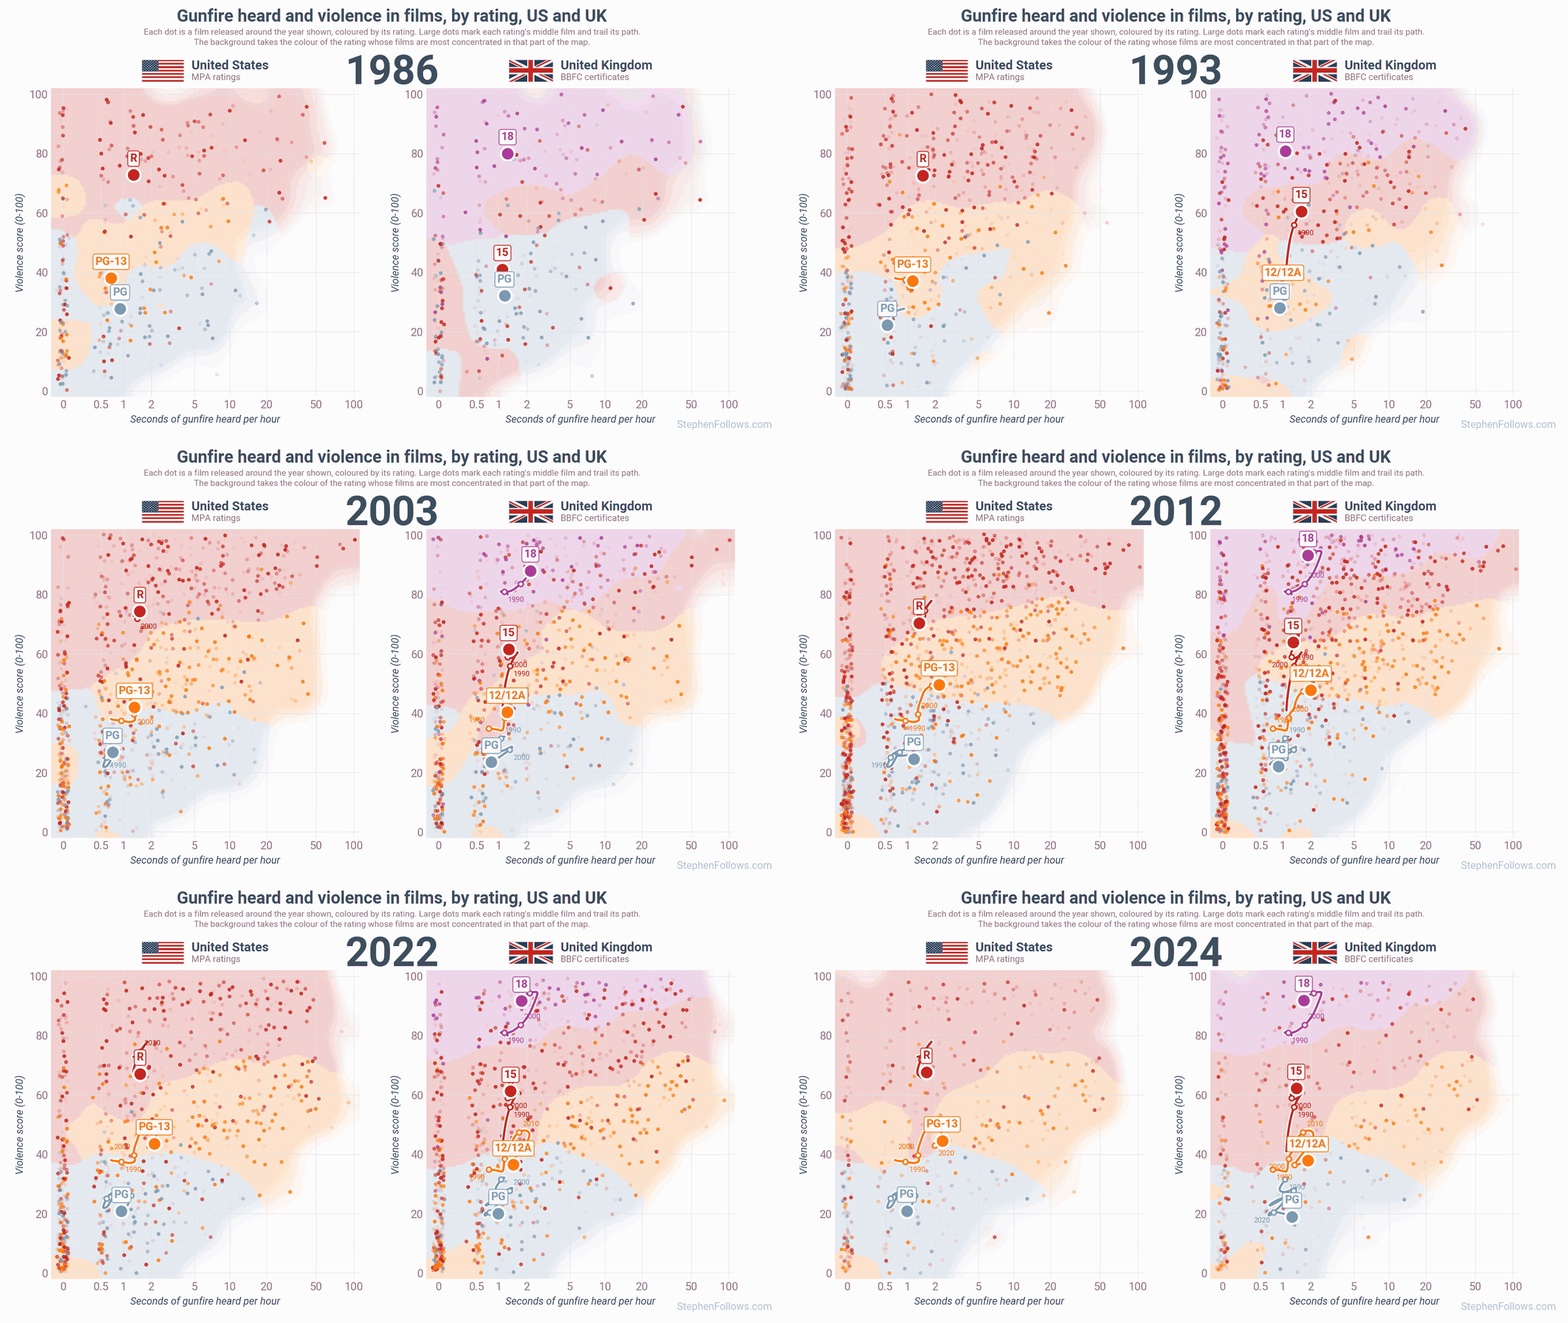
It’s a bit of a long article, so let’s start with a pretty gif as a TL;DR.
Each dot is a film, placed by how much audible gunfire it has (left to right) and how violent viewers judge it to be (bottom to top). The background colours show which rating’s films are most concentrated in each part of the map, and the large dots follow each rating’s middle film, with the US on the left and the UK on the right.
Look at the orange dots (i.e. PG-13 in America and 12A in Britain). They move a long way to the right, into the same range of gunfire as the adult ratings, but stay well below them on violence.
Ok, let’s get into the details of the data.
Gathering signals
The original study counted gun violence by asking people to watch half of the 30 top-grossing films of each year and mark every five-minute stretch in which a gun was used violently.
That method certainly counts when a trigger is pulled, but not what happens next. I don't think that fully matches up with what people mean when they call a film “violent”.
So I built my own measures.
Gunfire. I used a detector that listens to each film’s soundtrack for gunshots and looks at its pictures for guns being fired, which I ran across the 30 highest-grossing US films each year from 1985 to 2025 (1,196 films total). It was trained to match human coders who had counted gun violence by hand in 448 of those films.
Violence. This looks at how violent a film feels on a scale of 0 to 100. A film's score is its place among all the films in my data, so a score of 80 means it is more violent than 80% of the 5,274 films that have a score.
Is there as much shooting?
The chart below shows gun-violence scenes per hour in the 30 top-grossing US films of each year, by rating.
In the late 1980s, PG-13 movies had an average of one gun-violence scene every two hours. That works out as 0.48 gun-violence scenes per hour. By the middle of the 2010s, that had risen to 1.70 per hour and was on a par with R-rated movies.
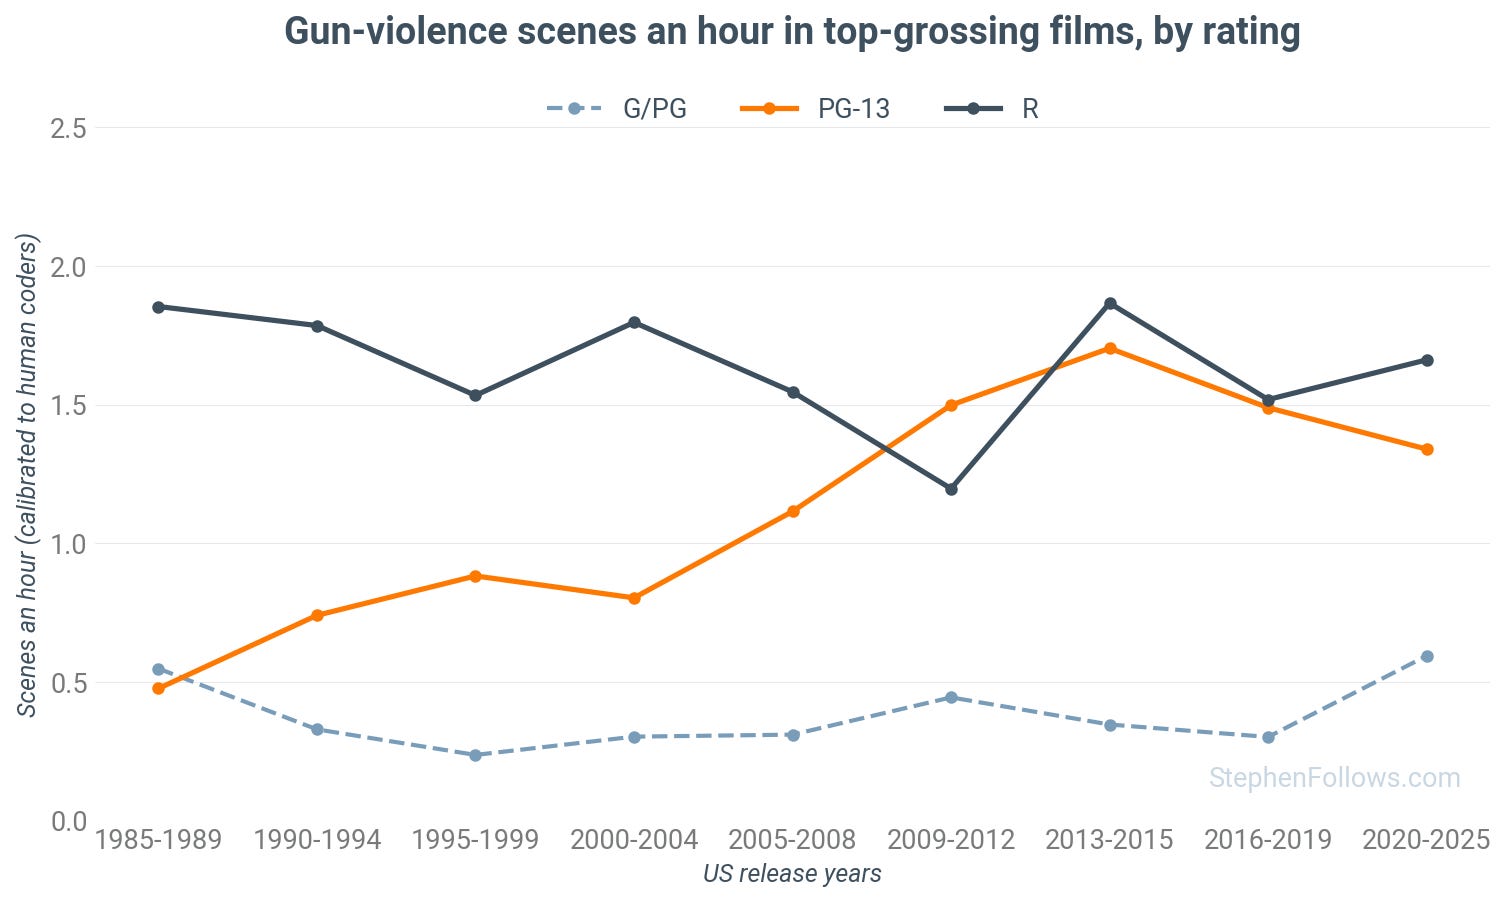
It has eased back a little since, to 1.34 per hour in 2020-25, against 1.85 for the R-rated hits of 1985-89.
Taking 2015-25 against 1985-94 as a whole, PG-13 films have 78% of the old R-rated level.
Is it as brutal?
This alone isn’t enough, as we have to be precise about what we’re actually measuring. My gunfire is tracking the act of a gun being fired and cannot take account of what happens to the bullet, or what/whom it hits. And what the audience sees after the shot is what most parents mean when they call a film “violent”.
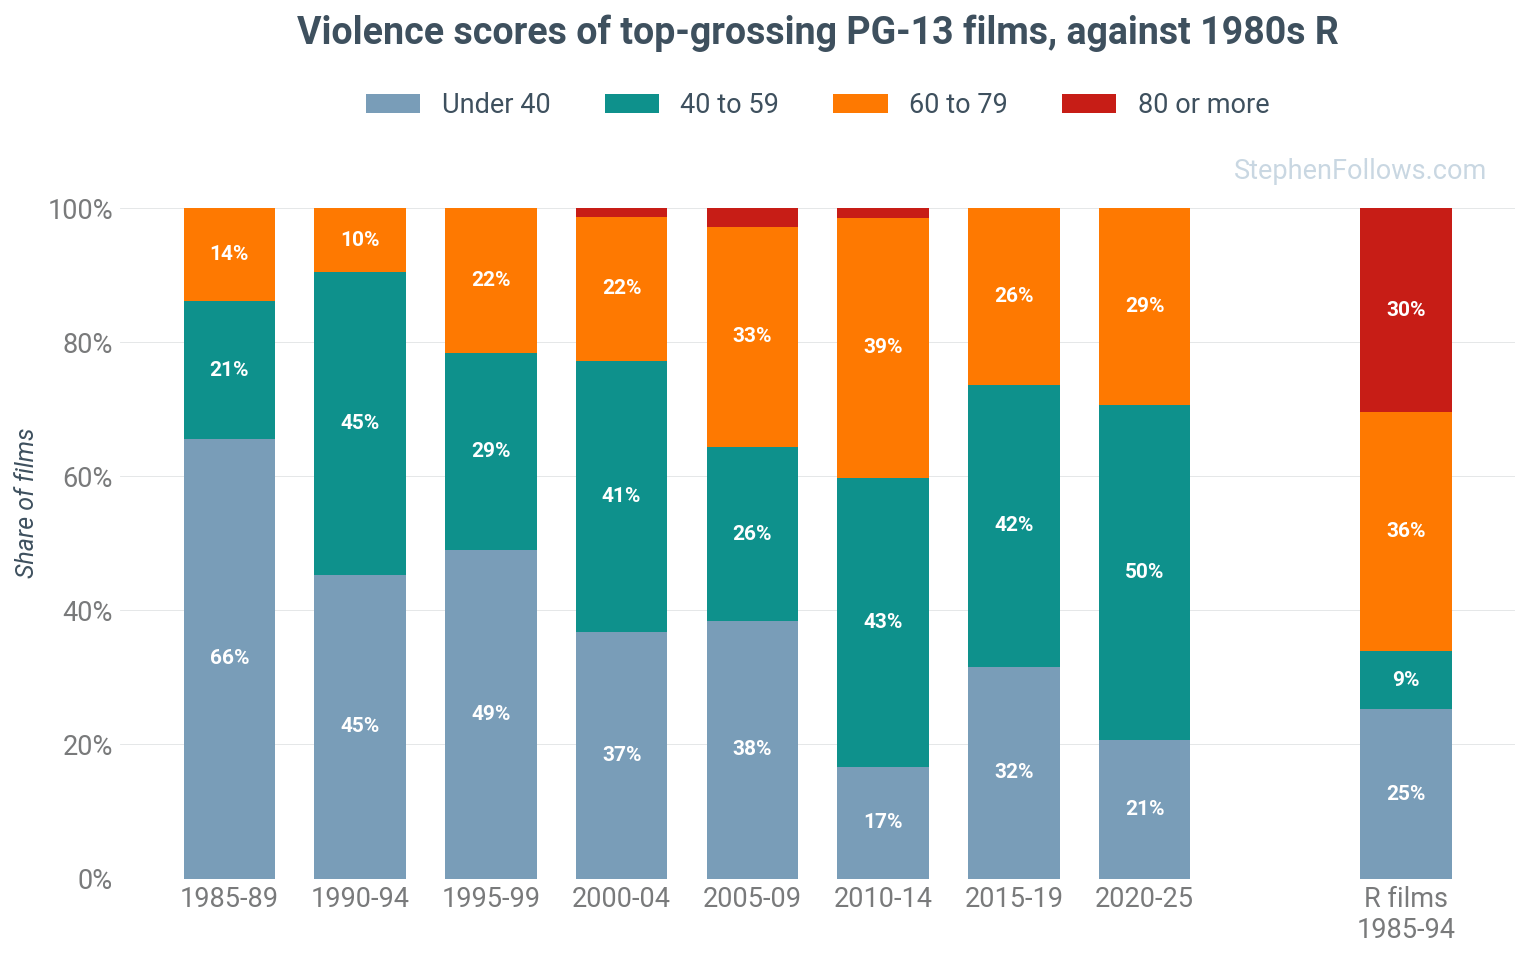
The chart below shows my measure of violence for top-grossing PG-13 films in each period, with the R-rated hits of 1985-94 on the right for comparison.
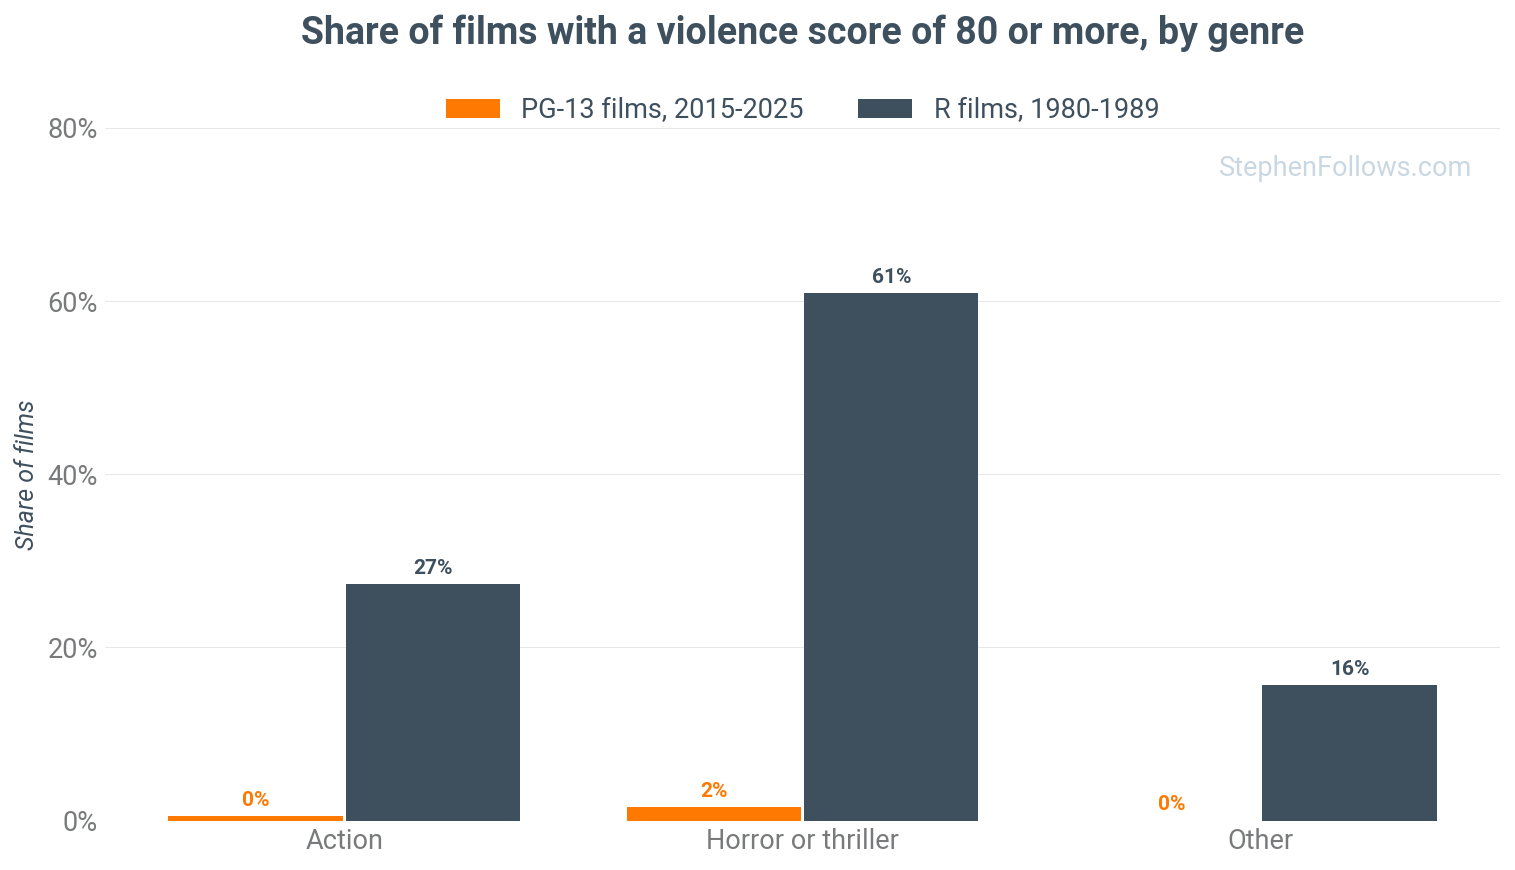
The orange band is where the two meet. Between 2015 and 2025, 28% of PG-13 hits score between 60 and 79, against 36% of the 1985-94 R films. The difference is all in the red. 30% of those R films score 80 or more, and not one of today’s PG-13 hits does.
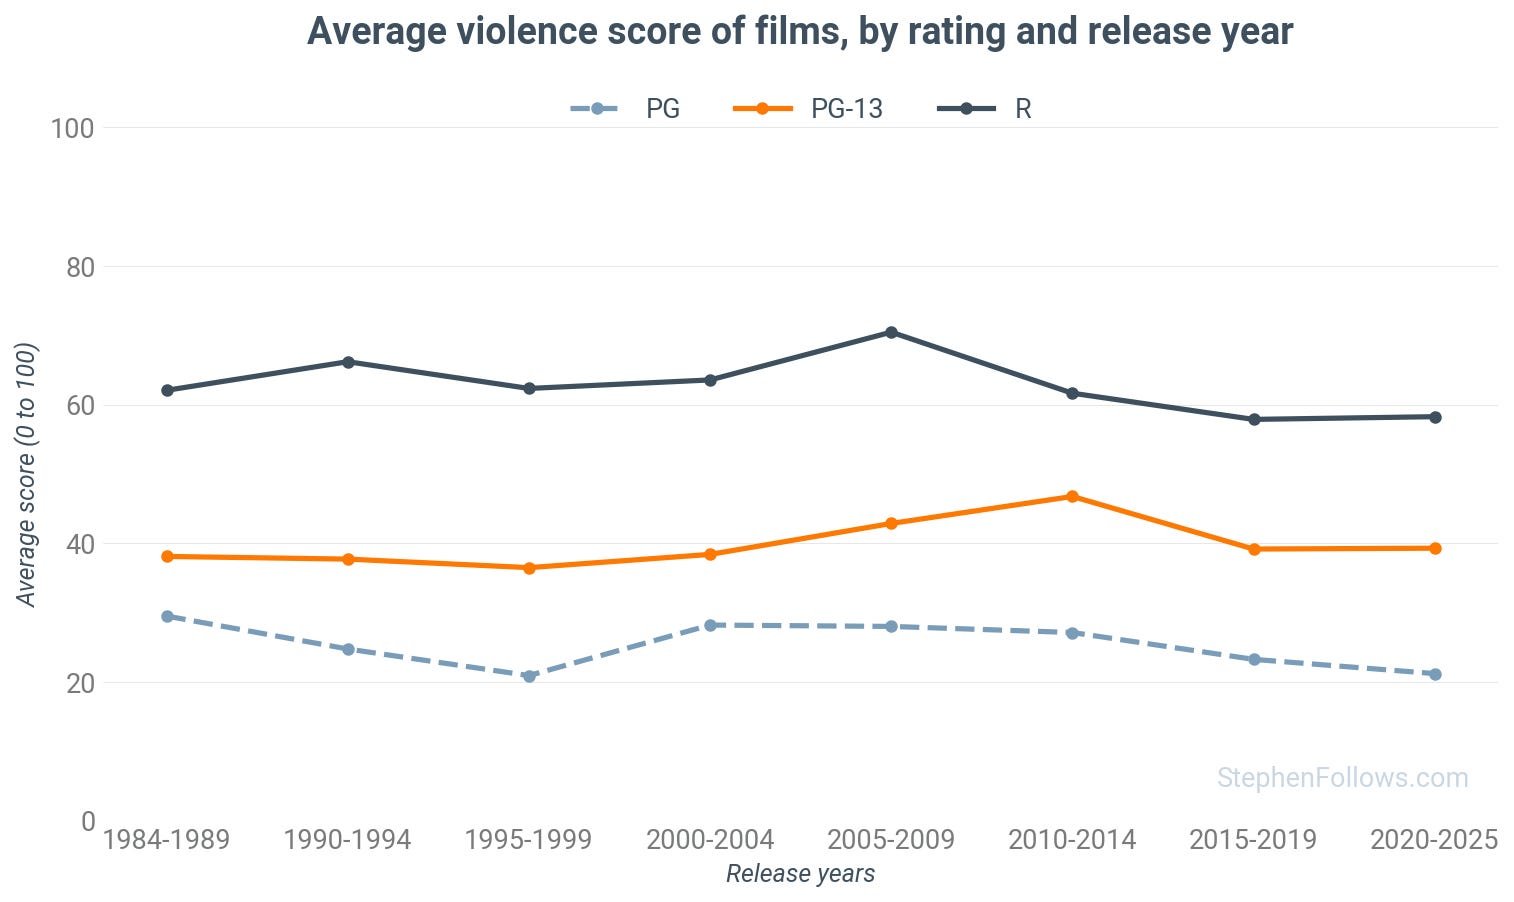
The same pattern holds well beyond the box office hits. Here are the average scores for all 4,523 films.
For forty years, the average PG-13 film has scored between 36 and 47, and the average R film between 58 and 71. PG-13 rose a little in the 2000s and has since fallen back, and the two lines have never crossed or come close. The original study found more gun violence in PG-13 films, and so do I. What I don’t find is PG-13 films becoming as violent as R.
Shooting without the blood
Putting the two measures together shows how far apart they’ve drifted. Each dot below is a period of top-grossing films, placed by how much gunfire they have (left to right) and how often they score 80 or more for violence (bottom to top), with each rating’s periods joined in time order.
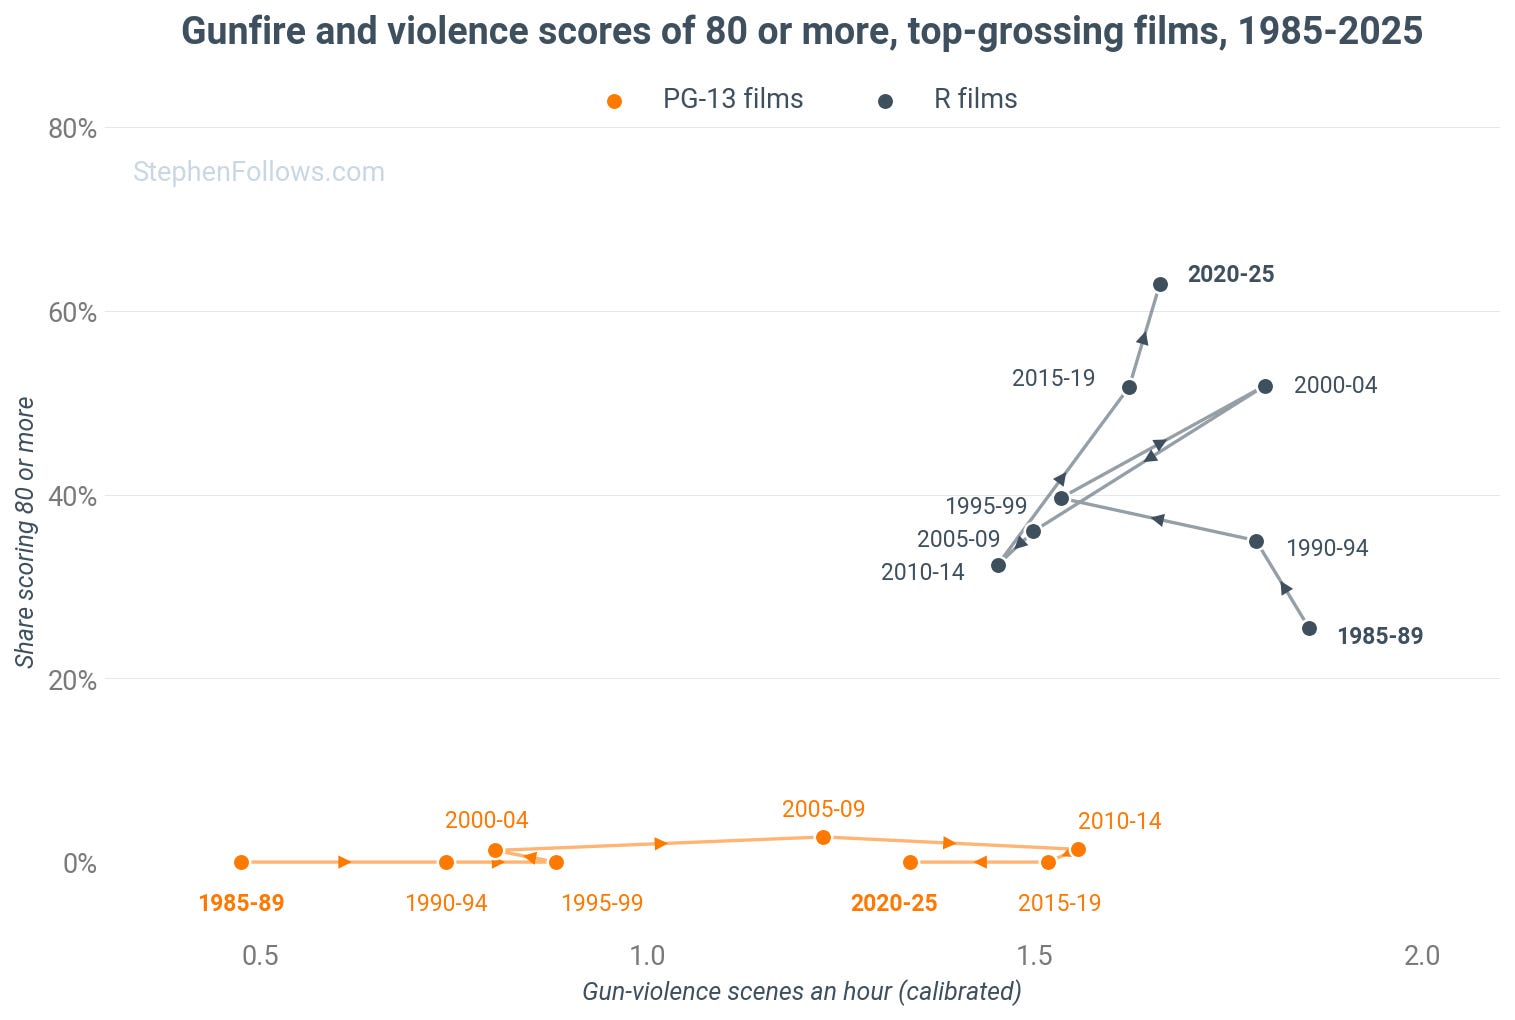
The PG-13 path runs along the floor to the right without moving up. Today’s PG-13 films sit below the 1980s R films, firing nearly as many shots and almost never scoring 80 or more.
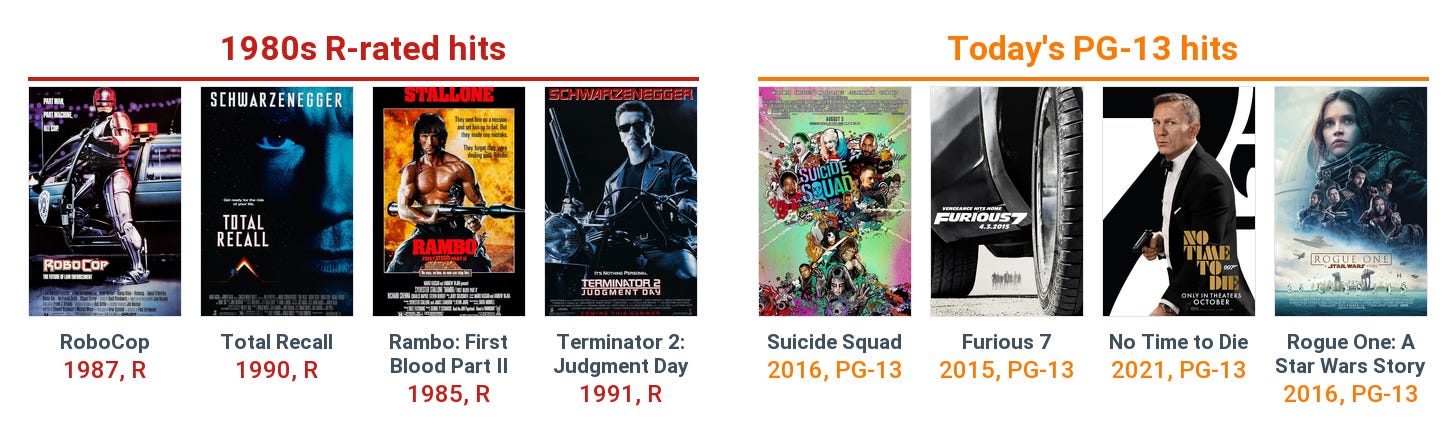
To see what that looks like on screen, I compared R-rated films with their PG-13 remakes or sequels, which share a story and an audience. The pairs are RoboCop (1987) and RoboCop (2014), Total Recall (1990) and Total Recall (2012), Die Hard (1988) and Live Free or Die Hard (2007), and Terminator 2: Judgment Day (1991) and Terminator Genisys (2015).
The shooting is in the same range.
RoboCop has 7.2 gun-violence scenes per hour in 1987 and 5.0 in 2014.
Die Hard has 5.2 and its PG-13 sequel 4.0.
Terminator Genisys (5.0) almost matches Terminator 2 (5.2).
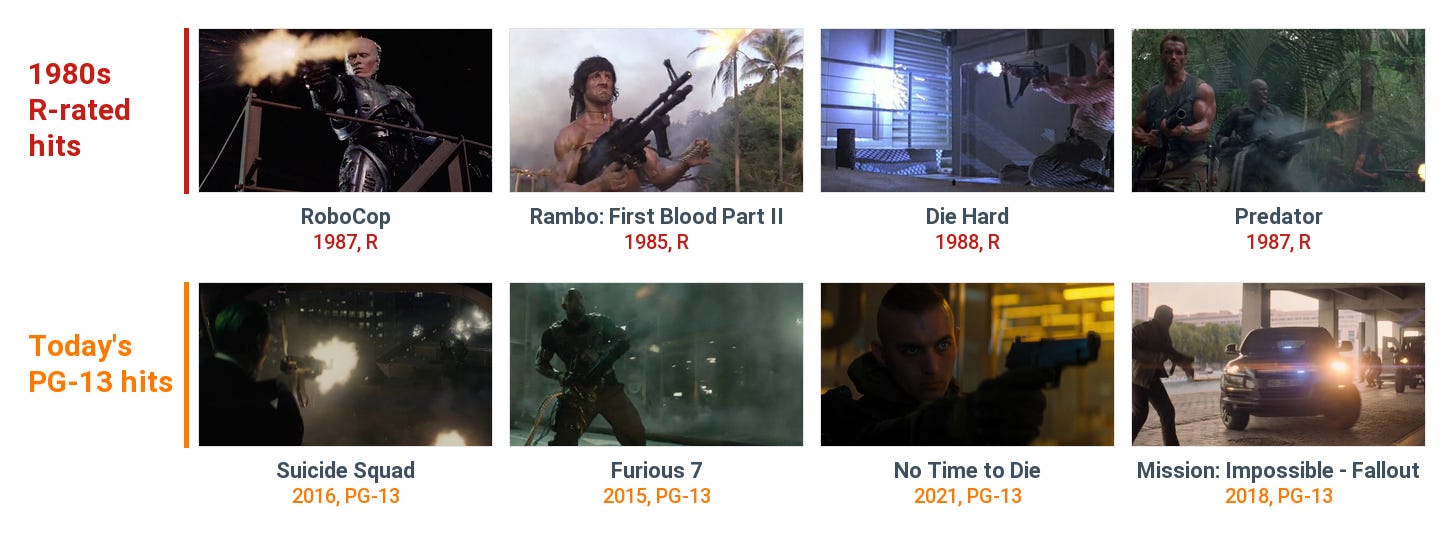
I took 20 bursts of gunfire from each film and looked at what we see on screen in the three seconds after the shooting started. In the R-rated originals, a person was visibly hit in 15% of gunfire moments, and in 58% of those we saw blood. In the PG-13 films, 5% of moments showed a person being hit, and all were bloodless.
Die Hard is the exception - its PG-13 sequel shows slightly more people being hit than the original does, though without blood.
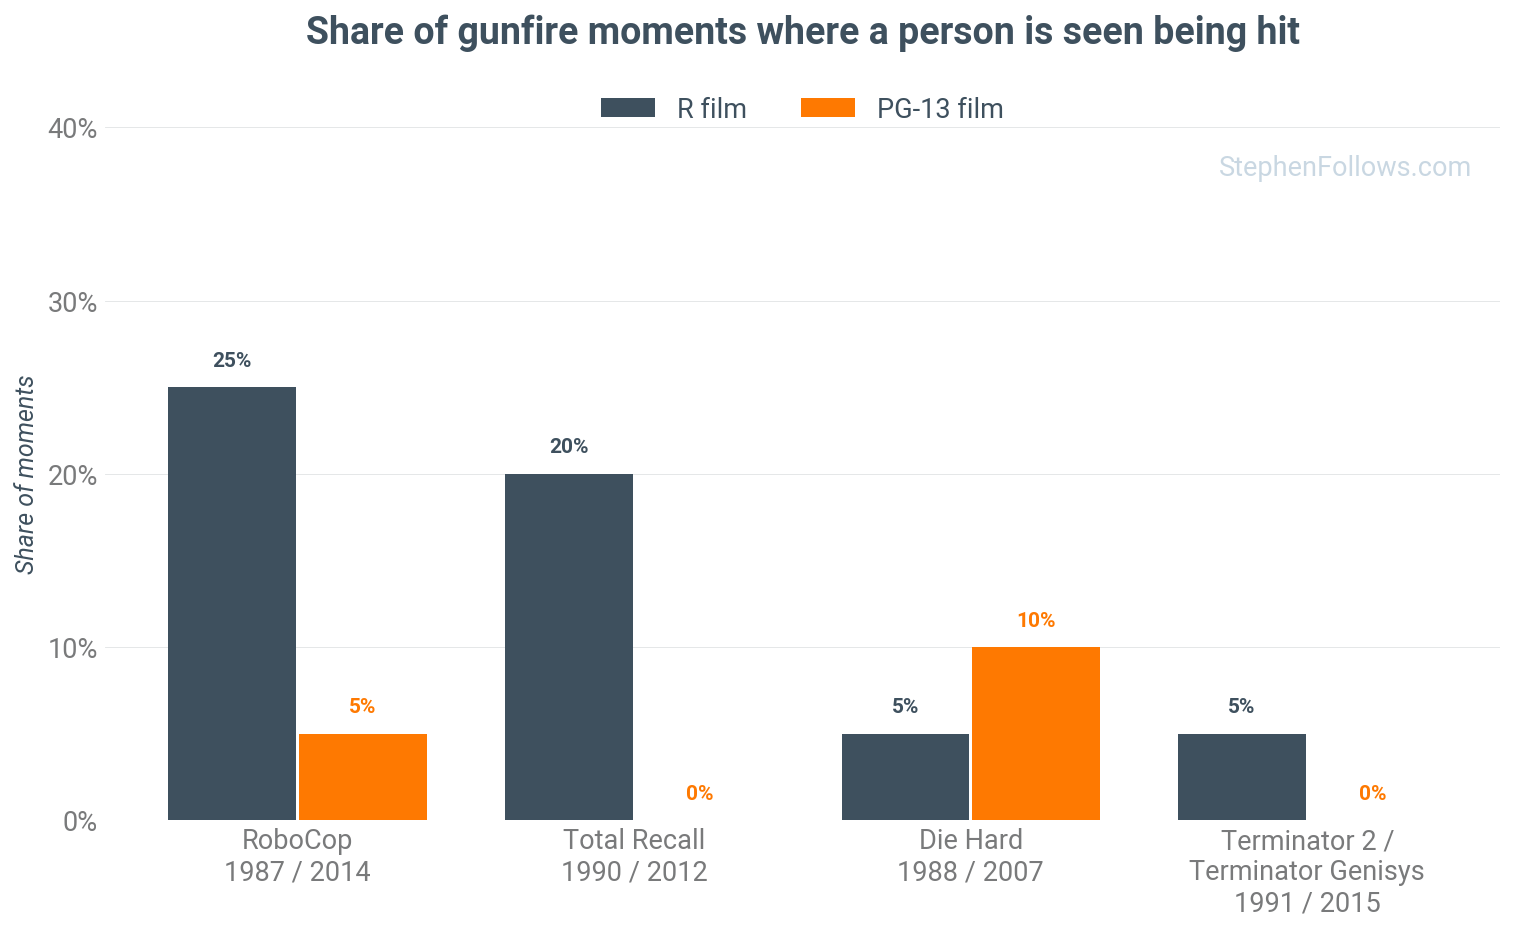
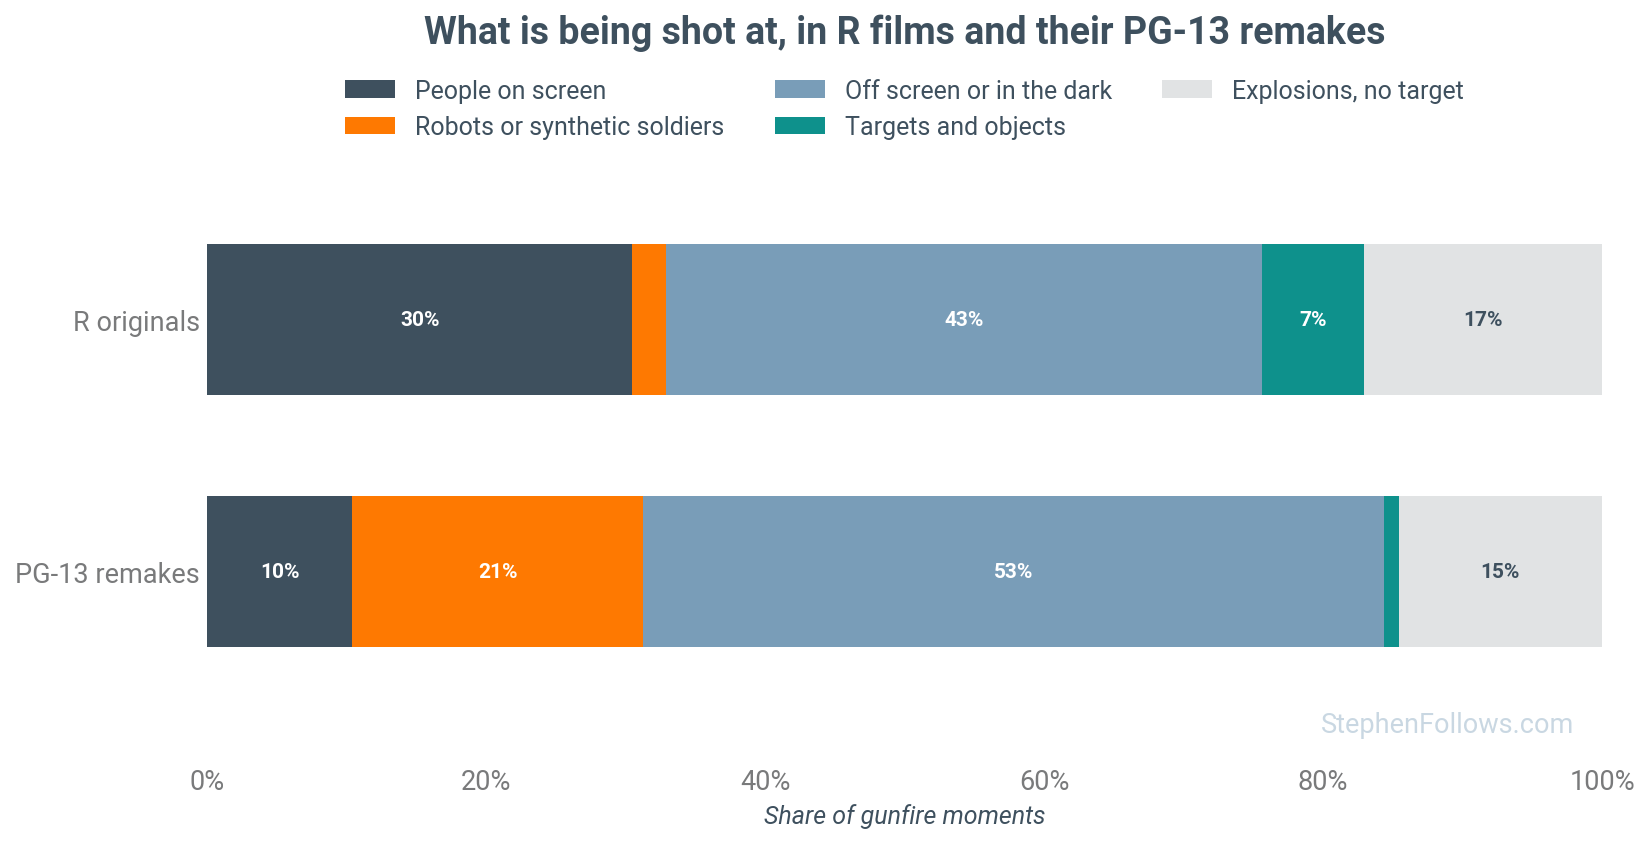
The other difference is what’s being shot at.
In the PG-13 films, 21% of gunfire moments are aimed at robots or synthetic soldiers, against 2% in the originals, and in the 2012 Total Recall it’s 60%.
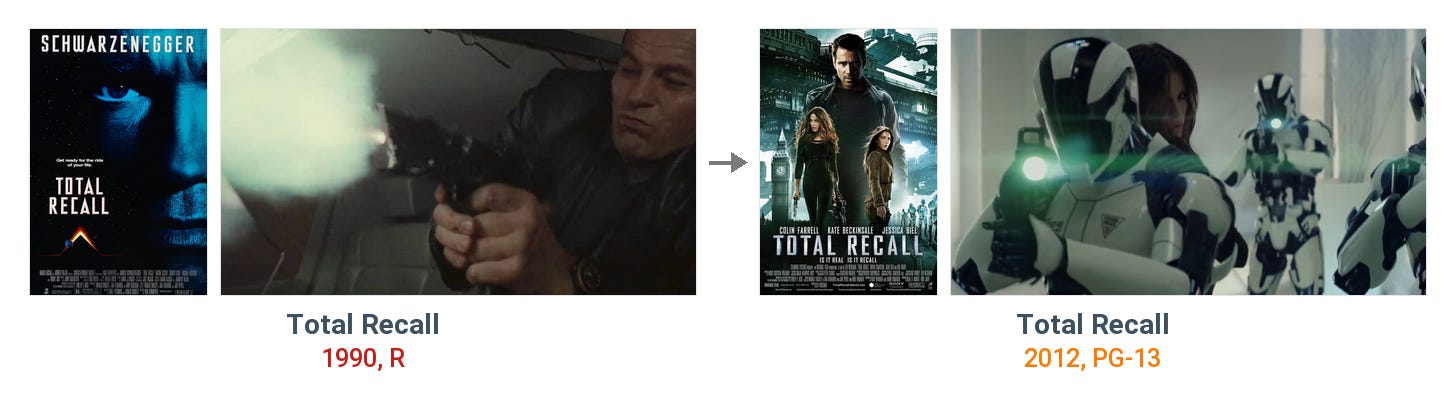
It’s a neat trick for any producer who wants both plenty of shooting and a PG-13 rating. Machines can be shot to pieces at any rating. People can’t.
This is the result of spot-checking rather than an across-the-board review, so the results are interesting rather than conclusive. Also, it’s not a one-way street. Commando (1985, R) has an enormous body count, but most of its soldiers die bloodlessly, and Taken (2008, PG-13) shows people being shot at least as often as Commando does. But across the remakes, the pattern is consistent - the same range of gunfire but with much less gore.
Why does it feel as if PG-13 has caught up?
So far, I have been talking as if the only thing to change is the movies. In fact, the criteria the rating bodies use also move, and have done so in both directions.
I wanted to get a sense of how much this was happening, so I trained a model on movie content (swearing, sex, violence, drugs, etc.) across different eras to decode what each rating meant at the time it was given.
This allows us to ask, “If movie X were released at another point in time, would it have been rated differently?”
Many of the 1980s PG films would be PG-13 today. Gremlins, Ghostbusters, Back to the Future and Top Gun were all PG, but my model gives each a 0.86 probability of receiving PG-13 by today’s standards. It’s not that they are massively offensive, but each has a little of the content that the current system regards as PG-13 material (mild violence, mild sexual content, a bit of drinking, a scare or two).
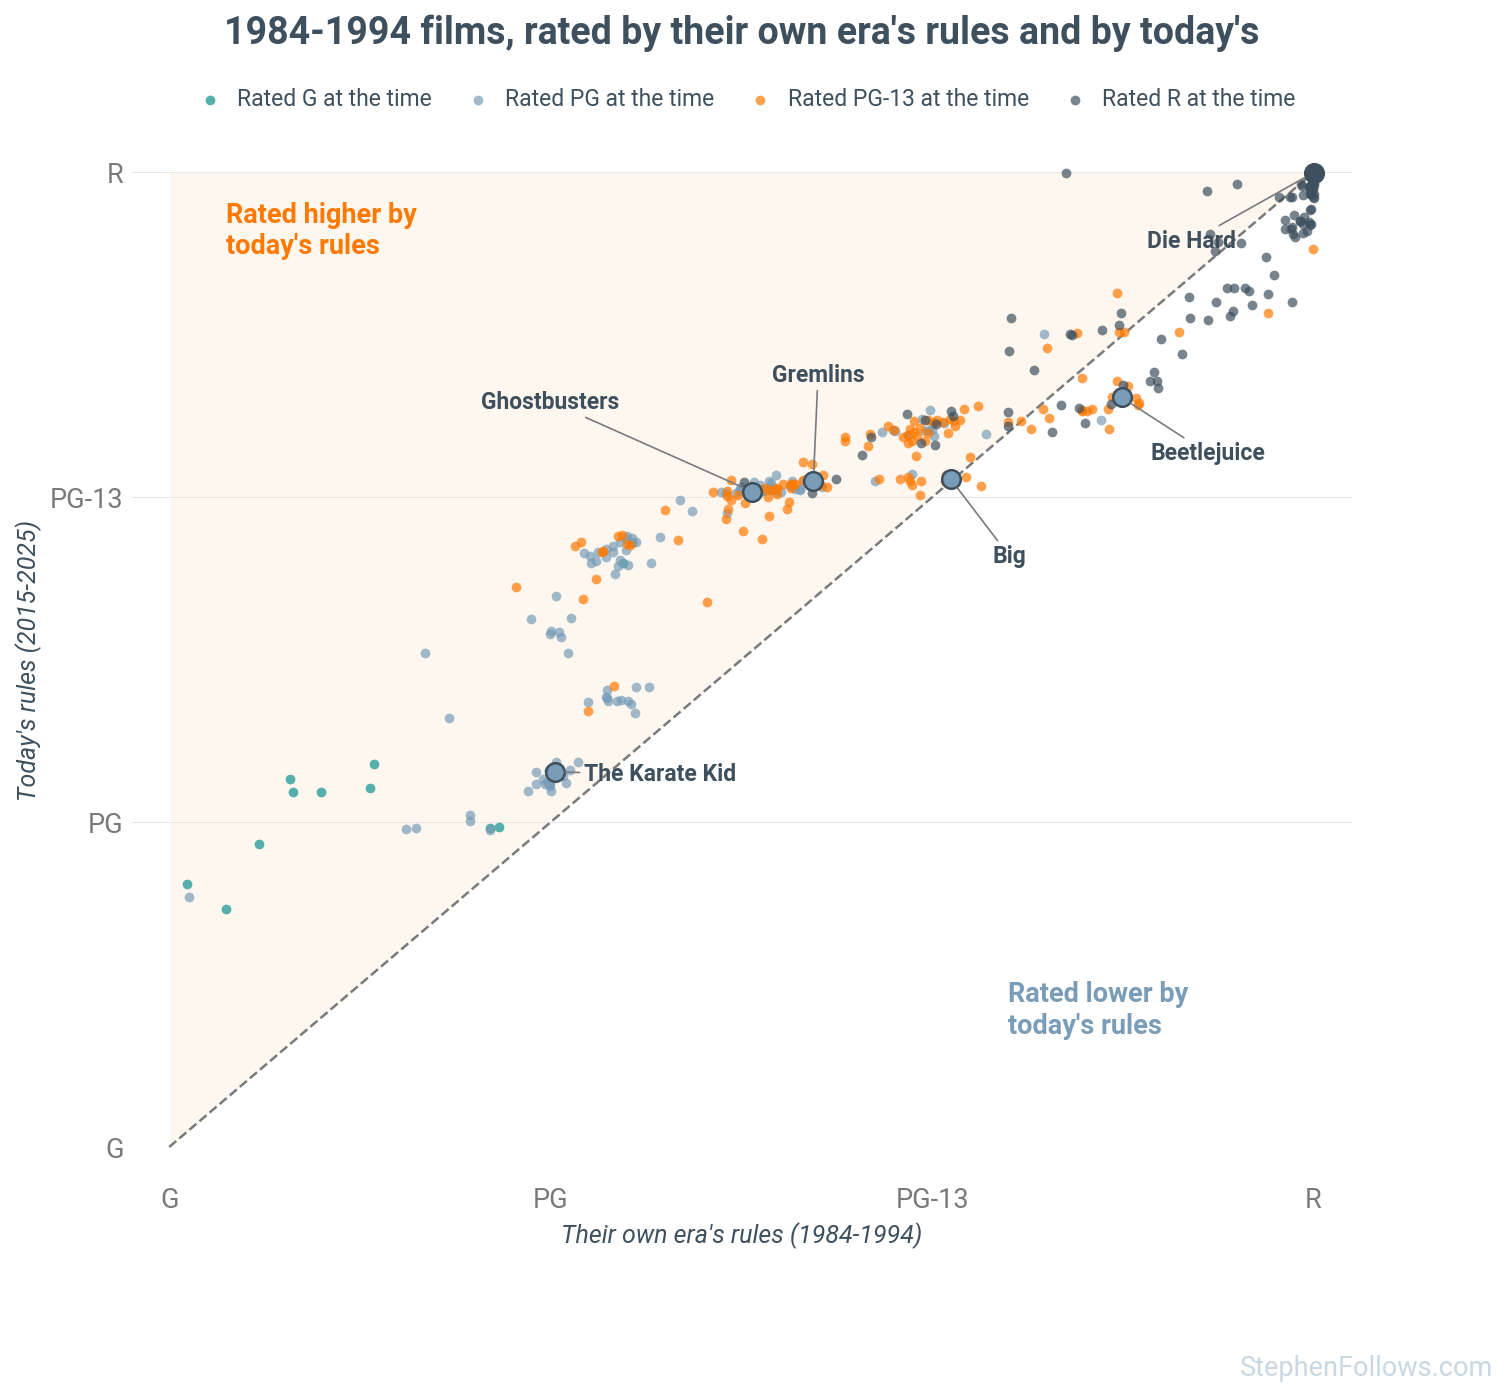
Anecdotally, the sequels also support this theory, as both Top Gun: Maverick and Ghostbusters: Afterlife were rated PG-13.
Now the other way round. A third of today’s PG-13 films would have been PG under the 1980s rules, and Ghostbusters: Afterlife is one of them. Another 11% would have been R, about half of them because of swearing.
This reverse direction is less certain, since the 1980s model is weaker. But the shape is clear enough. PG now allows less, PG-13 covers far more of the middle, and the violence at the top of R has stayed out of PG-13’s reach.
Looking to Britain for some sense checking
The British Board of Film Classification (the BBFC) re-rates films when they are re-released, giving us a natural experiment to sense-check my model against.
The US and UK systems differ, with subtle differences in what they care about, but the overall direction of travel is similar.
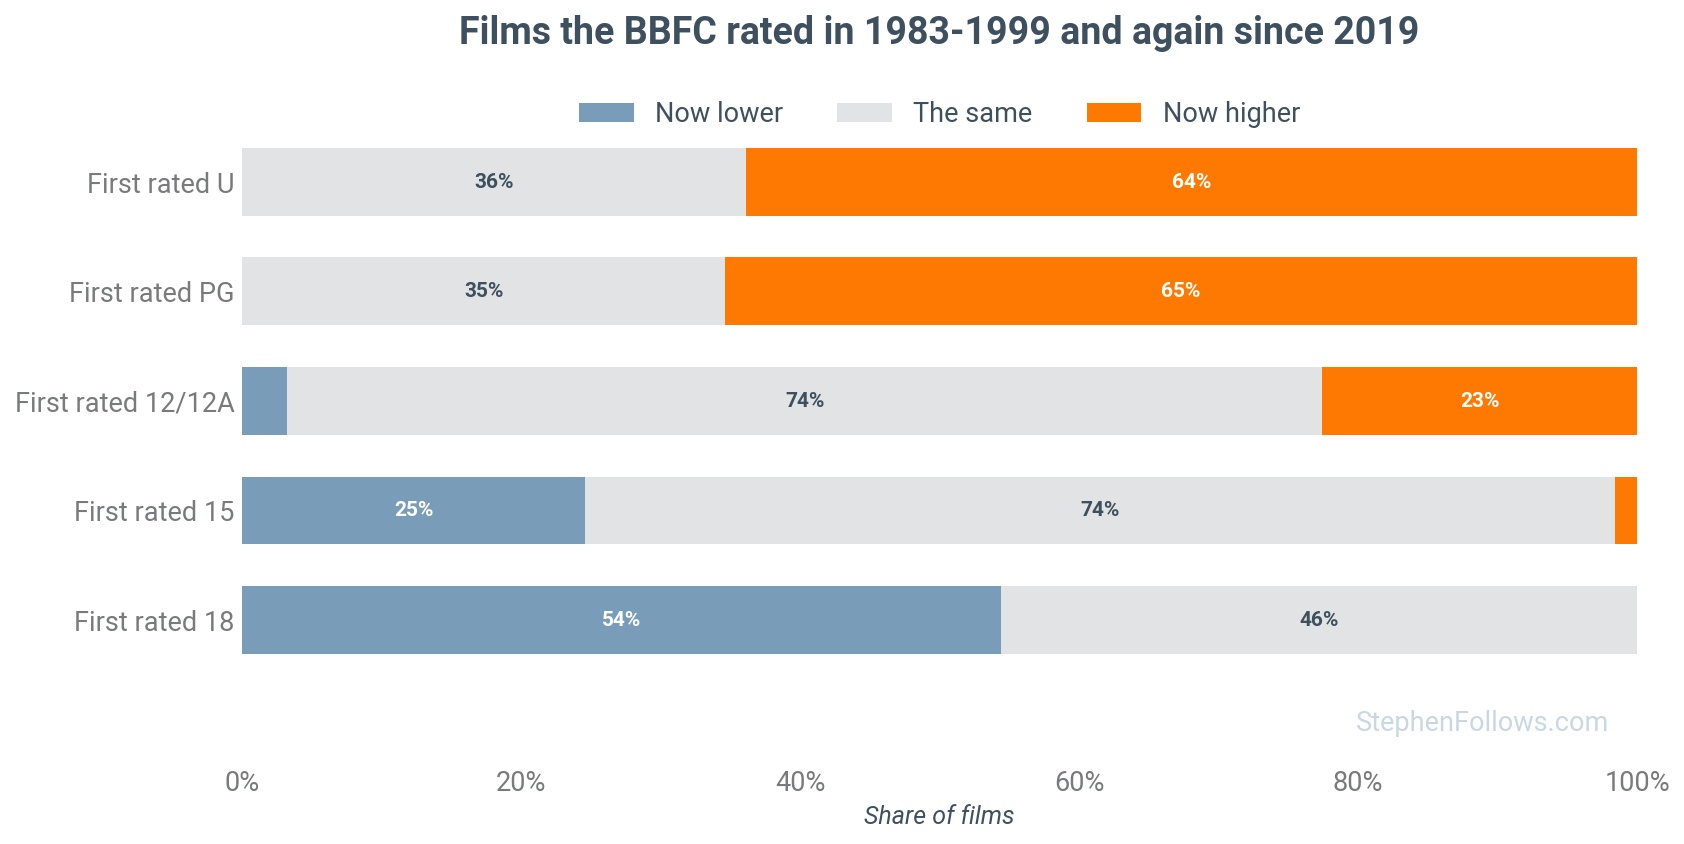
65% of the old PG films and 64% of the U films came back with a higher certificate, while 54% of the old 18s came back with a lower one.
Die Hard went from 18 to 15 in 2013.
The Terminator from 18 to 15 in 2024.
Gremlins went from 15 to 12.
Top Gun went from 15 to 12A, the opposite way to the American re-rating, because in 1986 Britain had no certificate between PG and 15.
The chart below shows films the BBFC first rated between 1983 and 1999 and then rated again from 2019 onwards, 559 films in all.
The BBFC now says it’s heading the other way on violence. In March 2024 it announced that violence, ‘particularly when intense or impactful scenes occur, may now require a higher rating across all age-rating categories’.
And blood has long been the sticking point for the BBFC too. For its 12A in 2012, The Hunger Games had ‘blood splashes and sight of blood on wounds and weapons’ digitally removed, when an uncut 15 was on offer.
Violent delights no longer have violent ends
So what we have learned is not that PG-13 films have become as violent as the R-rated films of the 1980s. If anything, the on-screen effects of violence have been reduced.
While it’s true that the R-rated films of the 1980s and the PG-13 films of today fire roughly the same number of bullets, they either miss their targets or we don’t get to see the bloody consequences.
Producers have learned that to hit their financial targets, their protagonists need to miss theirs.
Notes
My detector scores every five-minute segment of a film for the chance that it contains a handheld gun being fired at a person. It uses the film’s sound (gunshot classes, kept apart from explosions) and its pictures (each shot compared with phrases such as ‘a person firing a gun’). The film list is the 30 top-grossing US releases of each year (1,230 films, 1,196 with video to score).
The violence score ranks every film that has one from 0 (less violent than any other) to 100 (more violent than any), using judgements made today, so the same standard applies to every decade. 5,274 films have a score; 4,523 of them are rated PG, PG-13 or R and were released from 1984 to 2025, and a score of 80 or more puts a film in the most violent fifth.
My US re-rating model is an ordered logistic regression (a model that predicts a rung on a ladder) fitted on 3,840 films with English subtitles and content measures, separately for 1984-1994, 1995-2004, 2005-2014 and 2015-2025. It uses lines with an f-word (in bands), any c-word, other swearing an hour, levels for sex, violence, drugs and frightening scenes, and whether a film is animated or a family film. It predicts the actual rating for 80% to 87% of the films it hasn’t seen. A film is named as one that ‘would’ change only where the model gives that rating a probability of 0.7 or more.
One objection to the time series is that we need to account for genre changes. As I’ve written about previously, horror is on the ascendancy, but even accounting for that, we still see the same effects at play.