


Hollywood Gadfly reached out to ask me to look into the data around the recent UCLA Hollywood Diversity report (you can read his take here).
UCLA have been publishing annual reports on diversity in Hollywood since 2014 (covering films from 2011 onwards), each with the core finding that diverse movies make more money.

Gadfly’s contention was that nobody ever seems to check the maths behind these claims. I realised I too had been reading versions of that headline for years but had never once checked it myself.
So I decided to take up the challenge and address the question: Do movies with diverse cast members make more money?
What I ended up uncovering was far more interesting than I thought it would be at first, and I learned a lot along the way about measuring subjective topics.
This is a long, complex piece, so I thought I’d help everyone with a TL;DR before we get into the detail:
Diversity is not one thing. “A diverse cast” can be measured in at least six defensible ways, with each method producing different findings for the same film.
The current headlines come from a shaky process. UCLA’s method is questionable and produces volatile results. The findings are more likely a result of the choice of method and the effect of small numbers than tracking a real connection.
Once you account for things like budget and release size, there is no academic consensus that increased cast diversity will lead to higher financial returns.
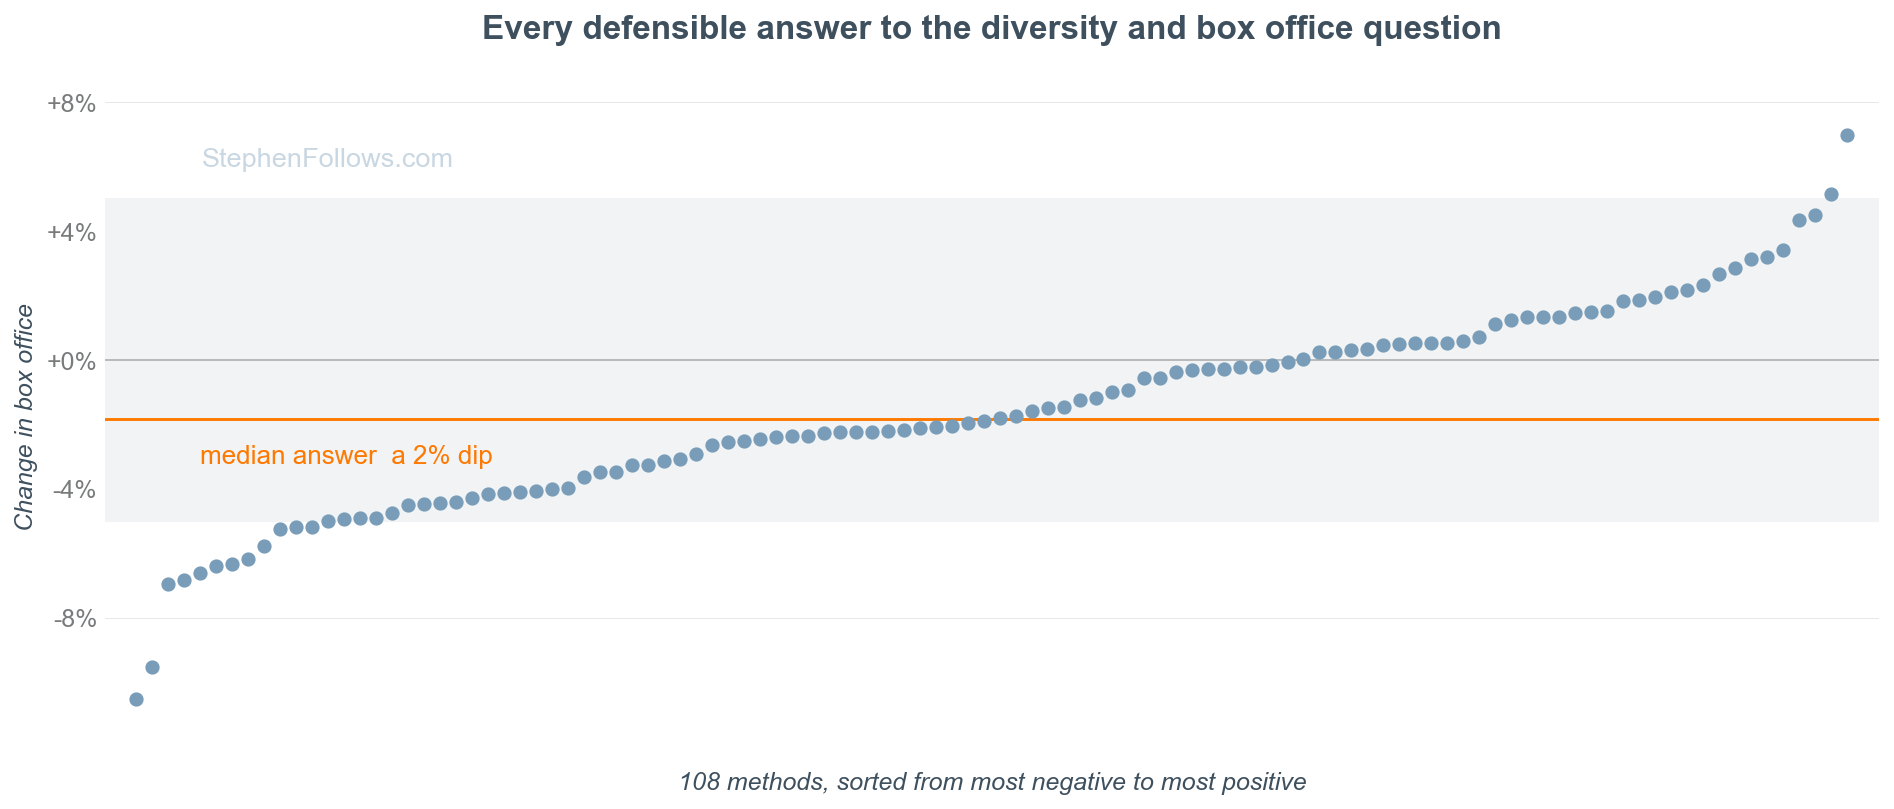
I tested 108 defensible methods across 2,600 films and 26 years. I found that almost all the methods produce no meaningful connection, and the median answer is a 2% dip. No method shows cast diversity meaningfully lifting box office. None shows audiences punishing it either.
The one pattern that survives everything tracks budgets, not audiences, with the most diverse casts being concentrated in the cheapest films. This is the problem the industry should be focusing on, rather than putting stock in the idea that cast diversity drives revenue.
Ok, let’s start at the top and work our way into the findings.
What does a ‘diverse cast’ mean?
“Diverse casts earn more” sounds like a single claim, but in fact it can mean two different things.
It can mean how much of the cast comes from minority backgrounds. Or it can mean how varied the cast is, i.e. how many different backgrounds are represented and how evenly.
I know they sound similar, but they are not, and the difference is more than pure pedantry. Look at the two fictional films below:
Movie one has eight actors, all from the same minority background, meaning that it is “100% minority actors” but has zero variety.
Movie two is mostly White but has lots of variety.
So which is the “more diverse” cast? Your answer depends entirely on which definition you use, and most headlines never say which one they mean.

Not to mention that “diversity” can cover background, ethnicity, gender, sexual orientation, disabilities, socio-economic background, etc, etc. I’m going to focus on ethnicity and gender for this article, but only to keep it focused, not because they are more important than others.
How do you turn eight people into one number?
I have laid out my methodology in detail at the end of this article, so I’m just going to gloss over it here for readability's sake. I looked at the top eight billed actors, plus the credited directors and writers, of the 100 highest-grossing films at the US box office 2000-25. For each person, I researched their publicly documented background from their own public statements, interviews, official biographies and reputable coverage, ending up with classifications for almost all.
We now need to turn that biographical data into statistics around diversity. This is much more subjective than you might think.
Here are six reasonable approaches one might take (names are my own):
Minority Share. The share of the top eight cast from minority backgrounds. The simplest and most common yardstick.
Weighted Share. The same share, but the top of the bill counts for more, on the logic that the lead sells more tickets than the 8th name.
Minority Lead. Forget the ensemble: is the number one name on the poster a minority actor, yes or no?
Mix Score. The chance that two randomly picked cast members come from different backgrounds. This measures variety rather than quantity.
Group Count. How many different backgrounds the cast spans, and how evenly. A cast split across four groups scores higher than a cast drawn from one.
Female Share. The share of the top eight cast who are women, kept separate from the race measures throughout.
Let’s take the example of Fast Five, the 2011 edition of the Fast and Furious franchise in which they drag a bank vault through the streets of Rio. Each method ranks it differently in my dataset, from being more diverse than 99% of movies down to more diverse than just 10% of them
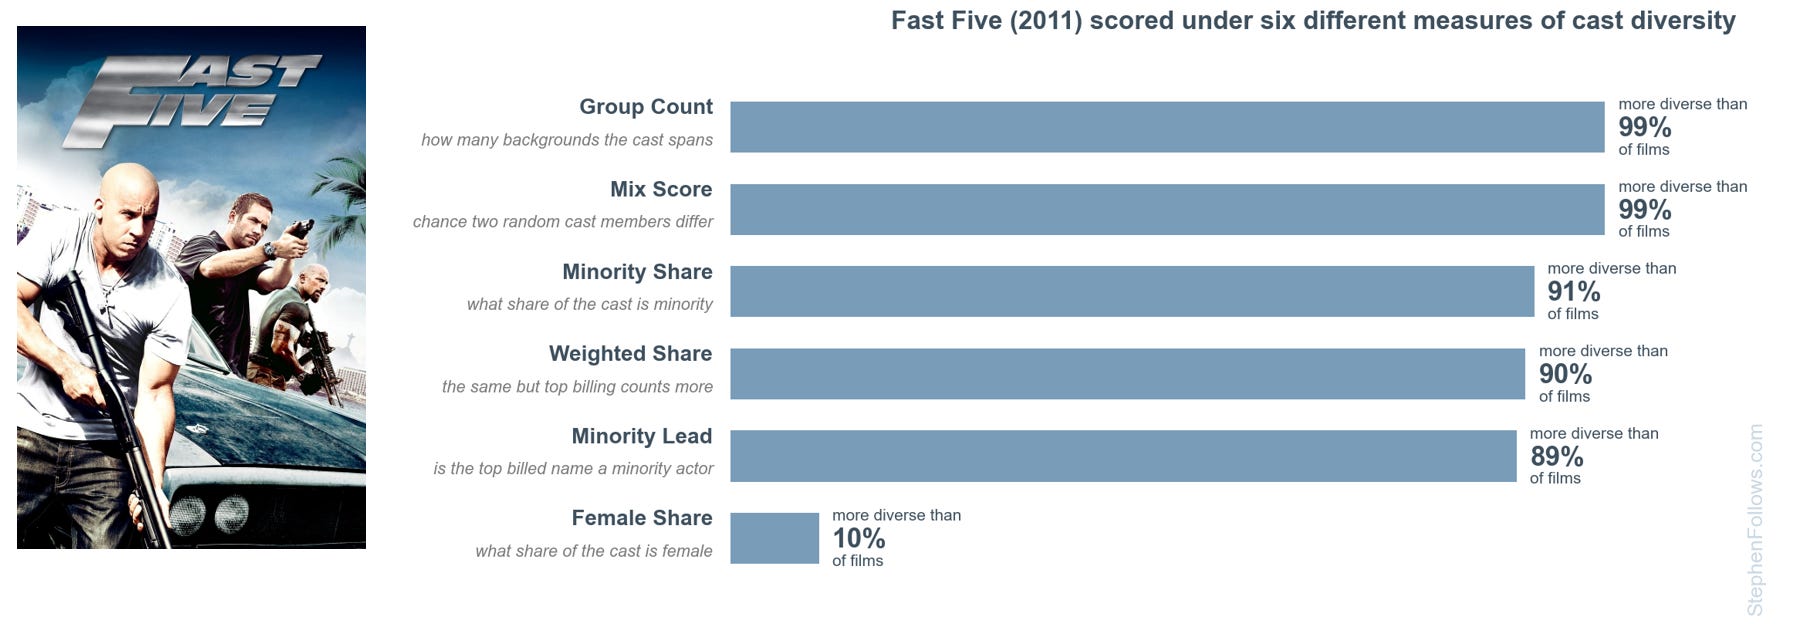
So when someone tells you “diverse films earn more money”, your first response should be to ask “What do you mean by diverse?”
Now, let’s tackle the second half of the claim by considering what we mean by “make more money”.
How do you test the money question?
You cannot just compare the earnings of diverse and non-diverse films, because films differ in ways that swamp everything else. A $200m franchise sequel will outgross a $5m horror whatever their casts look like. So we should compare like with like - same genre, same year, franchise against franchise, animation against animation, and so on.
But sadly the complexities of the real world mean that it’s not that simple. Some things that look like fair controls are actually part of the subjectivity and might mean the person who's doing the counting has their hand on the scales.
The number of cinemas a film opens in is decided by the distributor, after seeing the finished film and deciding how hard to push it. If films with diverse casts were systematically given smaller releases, then “controlling” for release size would remove the very thing we are trying to measure. The same logic applies, more arguably, to budget, where the final budget is heavily linked to casting.

If at this point you’re getting exasperated at the futility of something that felt like a simple question, don’t worry! Because we cannot fairly pick just one methodology without adding subjectivity, I tested many.
But before we look at all the tests I ran, let's look at the study that prompted Hollywood Gadfly to reach out to me, the UCLA Hollywood Diversity Report.
What does the best-known study say?
The Hollywood Diversity Report has been published annually since 2014 by researchers at UCLA. It is a serious, long-running series, with its authors having studied this field for over a decade.
They use the "Minority Share" method I mentioned above, sorting films into six bands (e.g. under 11%, 11 to 20%, and so on up to over 50%), then comparing the median box office of each band.
The latest edition reports that films in the 41 to 50% band earned the highest median global box office. They note that:
This cast diversity interval happens to align with the BIPOC share of the U.S. population (45.2%).
And the report concludes:
As found throughout this report series, new evidence from 2025 further demonstrates that America’s increasingly diverse audiences prefer diverse content in theatrical film releases.
This tidy, optimistic, quotable finding has been the source of a decade of headlines on the topic.

There are two rather big problems with the method, and consequently with the conclusion.
Problem one: The banding method is unreliable
Their scale sorts films into bands 10 points wide. But a cast here is eight people. This means that one person represents 12.5 points. The smallest possible change in a cast is bigger than the width of the boxes the films are being sorted into.
Let's see what this means in practice. If we imagine a film with zero minority actors, then it will be in the under-11% band. If the 7th- and 8th-billed actors are recast to be minority actors, then the film jumps up to the 21%-30% band straight away.
This is the kind of casting I doubt most audience members notice, and yet the film has crossed two full bands.
It’s true that representation of all types matters, and that it's important for people to see characters like them on-screen. However, it feels a stretch to then extrapolate that to the point where you’re attributing the film’s overall performance to the two minor casting changes.
The banding method they use massively amplifies the effect of minor casting choices and creates data which implies there are big differences between films which are, for all practical purposes, not different.
Problem two: the results are very inconsistent.
If the sweet spot were a real feature of audience behaviour, you would expect it to show up year after year. The chart below tracks the winning band in each year of the report series’ own published tables, going back 15 film years
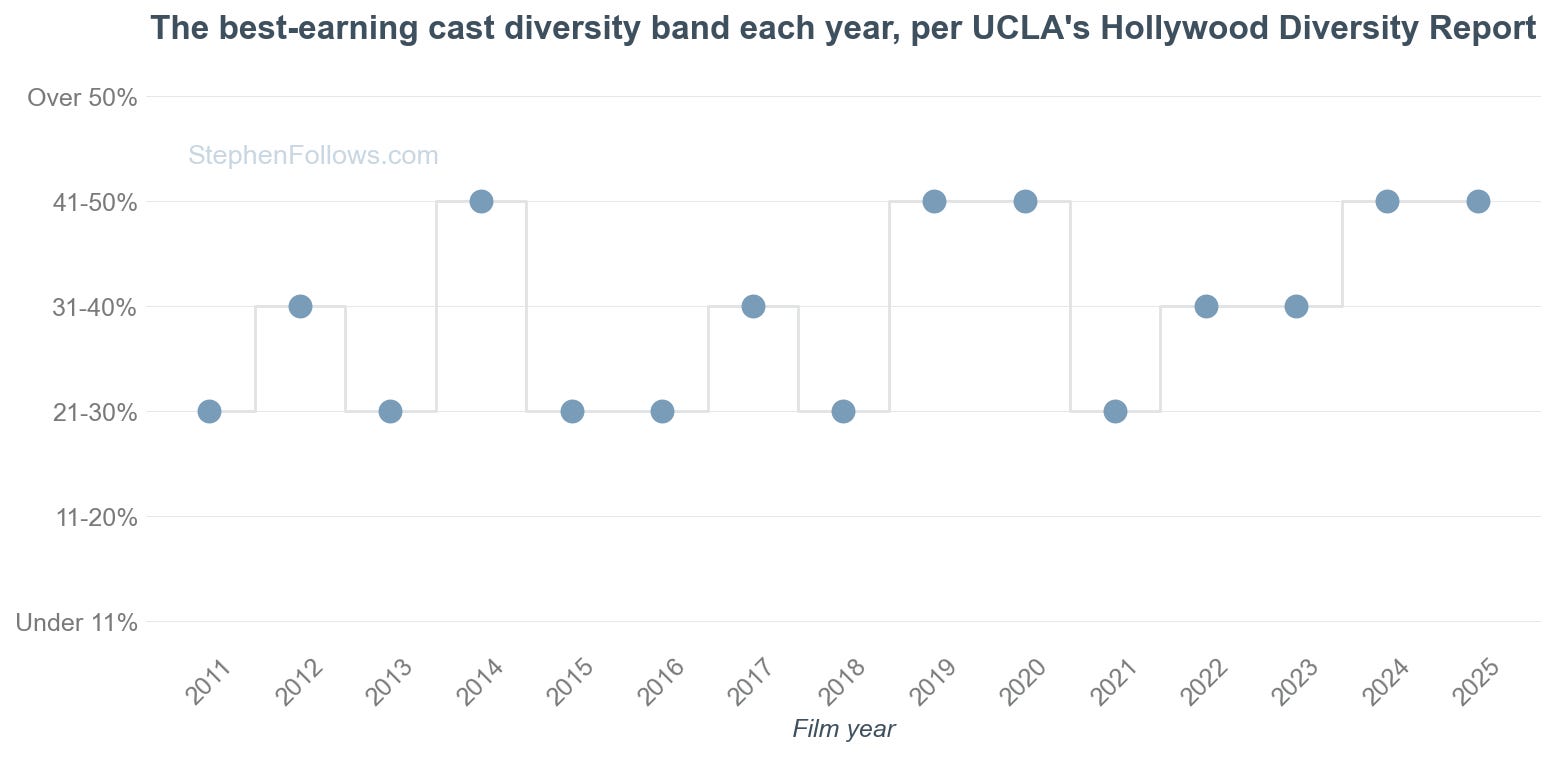
The winner has bounced across three different bands. The 21 to 30% band has won six times, the 31 to 40% band four times, and the 41 to 50% band five times.
The recent run of 41 to 50% wins, the one that aligns so pleasingly with the population share, describes the last couple of years of a series that spent a decade contradicting it.
And this is where I can add my new data, to go deeper than the UCLA published tables. I rebuilt my own 26-year version of their exercise using their method. I believe I have almost all the same classifications of individuals, but, as we have seen above, even one different classification can have outsized effects on the final data. So my charts are not an exact copy of theirs.
The chart below is entirely my data, and shows (a) how volatile their method is; and (b) that there hasn’t been a sweet spot for diversity this century.
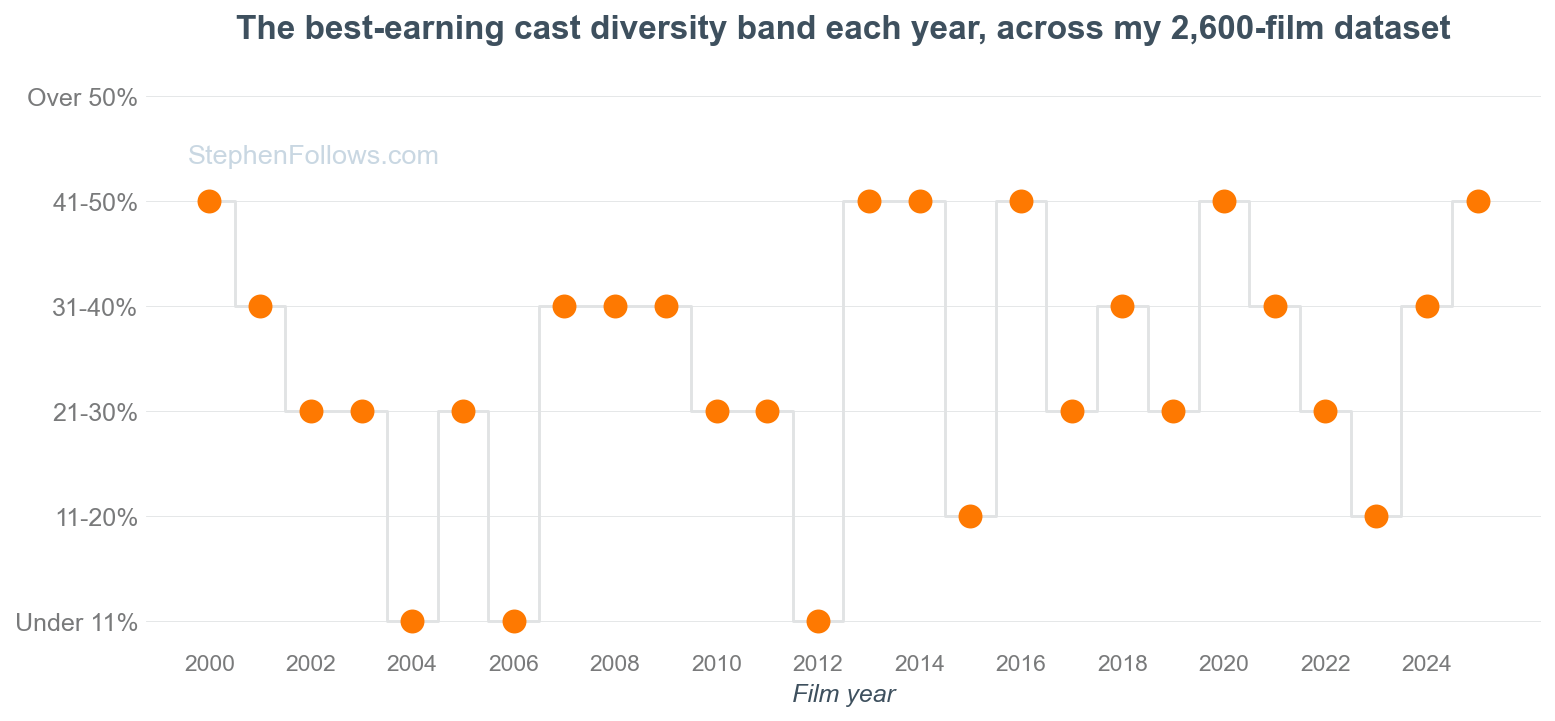
So the UCLA data does not provide a robust, clearer answer than the headlines would have you believe. Instead, it reflects the often changing output of a particular method, heavily influenced by the property of small numbers.
What have other studies found?
I had built up a cache of 29 other studies and reports on the topic, to see what others have said on the issue (details and links in the Notes section).
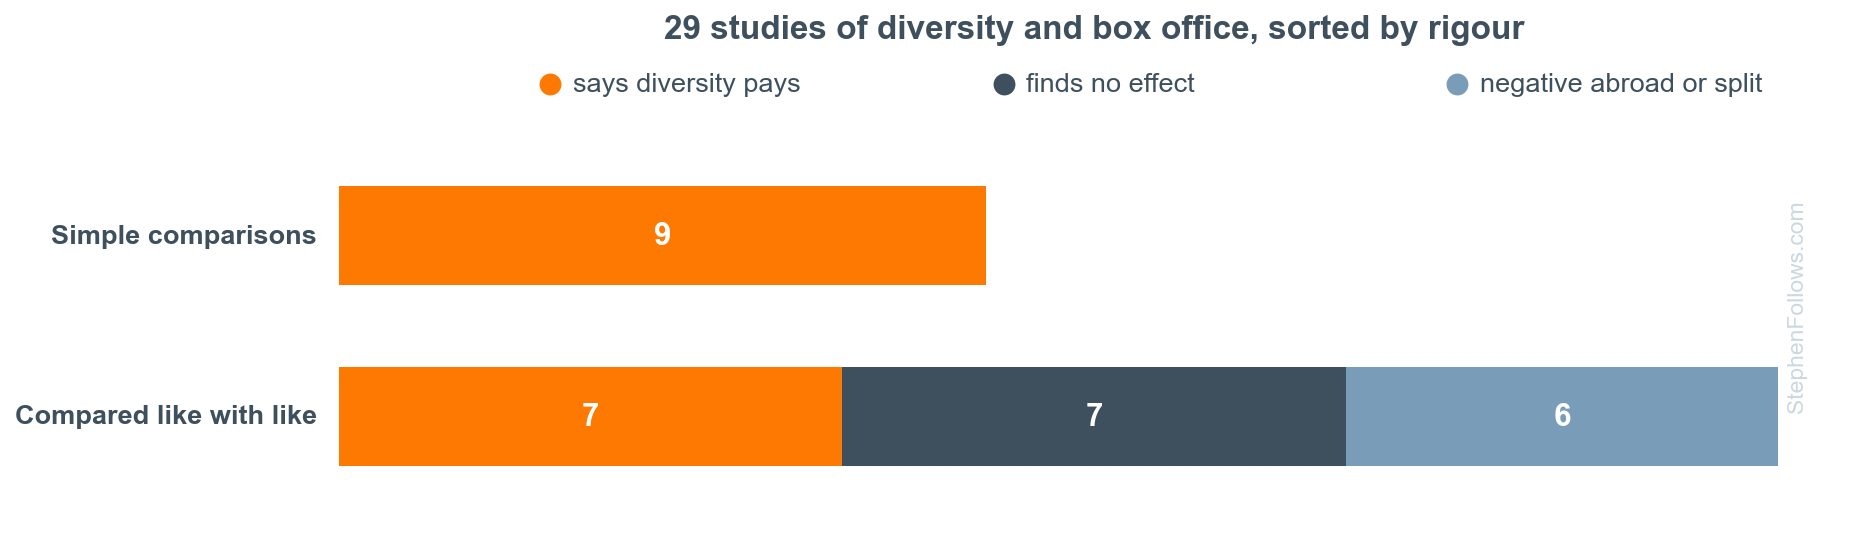
16 found a positive link between diverse cast and financial success, seven found no effect, and six found negatives abroad or results that split by market and method.
But yet again, we need to look under the surface. Nine of those positive studies did not control for other factors, and the seven that did mostly used only the US box office.
Every study that compares raw grosses concludes that diversity pays. These are also typically the studies behind the headlines, such as the annual diversity reports, the talent agency indices, the consultancy studies with the billion-dollar opportunity numbers. But because they do not control for key factors, we cannot count them as rigorous tests of the claim.
Of the studies that do compare like with like:
Several found genuine positives for Black-led casts in the US market.
Seven found nothing at all.
Six found negatives abroad, or answers that flip depending on the market, the measure or the statistical correction.
One finding was reported as a 149% revenue boost for films with multiple Black leads when its working paper made headlines. By the time peer review had finished, the published figure was revised to 47%. It is a genuinely good piece of work, and its published finding still stands as one of the strongest positives in the field. But I wanted to highlight it here to show how far a headline number can travel from the figure that survives review.
So we are STILL left with a murky picture. I’m sure by now you are screaming at the screen - Stephen, please just answer the damn question! Do diverse casts make more money at the box office, or not?!
Ok, ok, I’ll have a go.
Asking the question every possible way
Rather than just picking a single subjective methodology, I decided to test 108 of them. That’s a combination of:
The six measures of cast composition we saw above.
With and without budget as a control.
Four different statistical models, including ones designed for the fact that box office is dominated by a few giant hits.
Worldwide and domestic takings.
Plus a version that only compares films from the same studio.
In total, 108 defensible ways of asking “is cast composition related to box office?”, every combination decided in advance so I could not fish for a result I liked or didn’t.
Each test produced a figure for the relationship between cast diversity and box office (worldwide and domestic were tested separately). A positive figure means the more diverse the cast, the more money it brought in, and a negative figure means the opposite.
I then plotted each result on the chart below.
86% of the answers land within 5% either way of zero, and the median answer is a 2% dip. It’s fair to say that there are few ways we can reasonably read the data to produce the finding that “more diverse casts earn more money”.
To give you a sense of how the tests work, here are five of the 108 answers, spanning the whole range:
The most negative answer anywhere was an 11% dip, which came from Minority Share against worldwide takings, using median regression (which asks about the typical film rather than the average) and no budget control.
A 4% dip was found for Minority Share against domestic takings, standard model, no budget control.
A 2% dip, indistinguishable from zero, showed up for Female Share against domestic takings, median regression, no budget control.
Almost exactly zero (+0.5%) was the outcome of Minority Share against domestic takings, using the skew-robust model with controlling for budget.
The most positive answer was a 7% lift and came from Group Count against domestic takings, standard model, no budget control.
A motivated researcher could truthfully report “diverse casts are associated with lower box office” or “more varied casts are associated with higher box office” from this same dataset, just by choosing the measurement criteria.
Both would be technically true, and if they didn’t reveal the 107 other ways to crunch the same data, we might never question it.
What this all adds up to
So my answer to the question "do films with diverse casts make more money than those with less diverse casts?" is no. I ran every defensible method on 26 years of hit films, and couldn't find a version of the analysis where cast diversity meaningfully lifts box office.
And the most rigorous academic work in the field agrees with me on this. Once budget, marketing and release width are taken into account, they dominate everything, and the cast’s own effect shrinks towards nothing.
The diversity of the cast is just not a meaningful factor when assessing the financial performance of films en masse.
By the way, there is no honest reading of this data in which audiences punish diverse casts either. What this exercise really measures, in the end, is the measurers. The choice of yardstick moves the answer more than the casts move the money.
(Regular readers may remember that last year I tested the “Go Woke, Go Broke” claim across 10,524 films and found no general rule there either. This all reflects the same idea that movies are very complex products and that it should not be surprising that their financial outcomes are unlikely to be reducible to one factor).
The one effect that is there and needs more study
A McKinsey study reported that Black-led films receive budgets roughly 25% lower than comparable projects. And this is a finding I replicated in my study too.
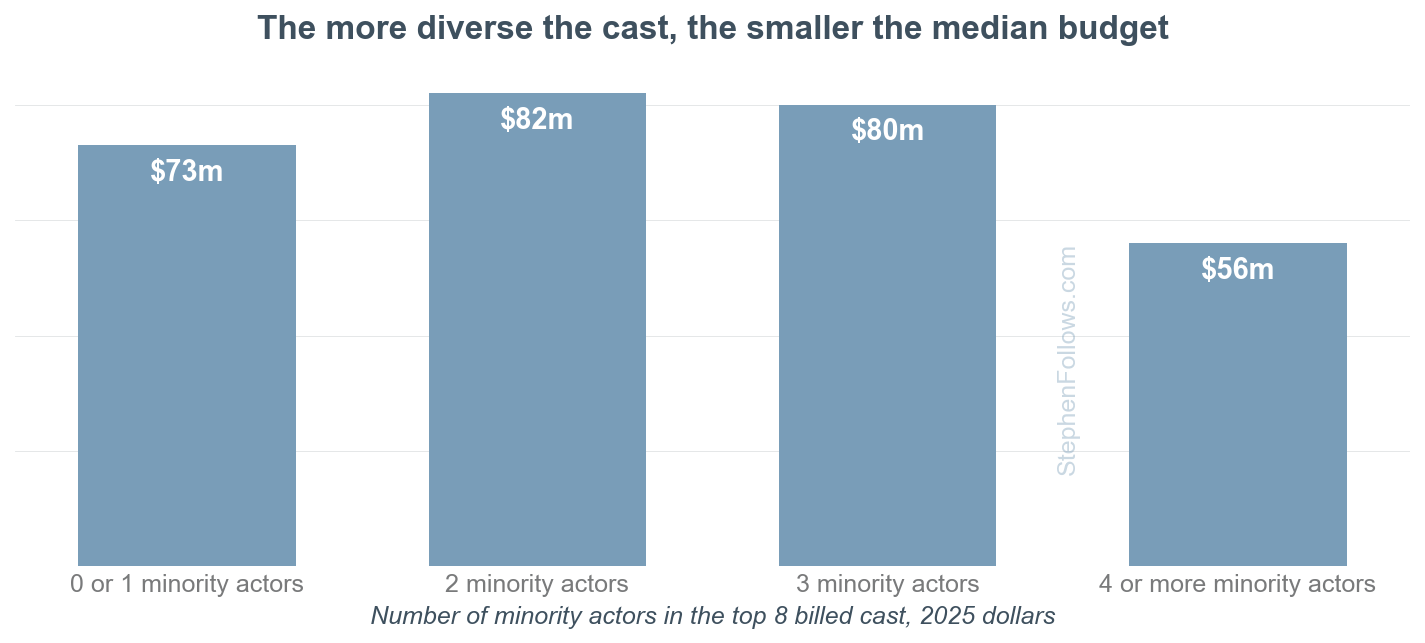
So something is happening in Hollywood, but it’s taking place in studio greenlight meetings, not by audiences in line at the cinemas.
There is a genuine question about why the most diverse casts are concentrated in the cheapest films, which deserves better study than a diversity band.
Advocacy versus academia
I want to end on a question that kept coming up when I was researching this topic: what are reports like this actually for?
There are two very compelling reasons to take the time to do what UCLA have been doing so consistently over more than a decade:
Advocacy. I.e. making the case for a fairer industry, the way a guild, a trade body or an agent would. There’s no doubt there is a lot wrong with how the industry currently functions, and we need dedicated, passionate people to take the time to make us all better.
Science. I.e. finding out what is true, including when it is inconvenient. It’s important we know how things operate and, ideally, why. This allows everyone to have the same view of the world and to make realistic plans and accommodations in their own lives.
Both jobs are valid and needed. But they are different jobs.
Given their language and press releases, I doubt many would disagree that the Hollywood Diversity reports are doing the former. They are passionately advocating what they believe needs to change and why. But they do so under the guise of the latter, an independent study from a university, a research institute, endnotes and all.
The series describes its own purpose as exploring “relationships between diversity and the bottom line in the Hollywood entertainment industry”. Their conclusion is that the binned medians “demonstrate” that audiences “prefer diverse content”. The latest edition puts it like this:
During a tumultuous era in the business of Hollywood, one thing remains true, films with relatively diverse casts tend to do better at the global box office.
Nothing in their tables is false, and I have no reason to doubt their commitment to gather data or computational rigour.
But the method behind the headline, raw medians of 10-point bands on a single year of top films, with no like-for-like controls, is one of the very few ways of analysing this question that produces a result that big, in that direction.
The UCLA answer is not THE answer. It is one answer from the far end of a distribution of many. It is the answer that sparks the headlines they feel are needed to change the industry in the way they believe it must change.
Notes
I studied the 100 highest-grossing films at the US box office in each year from 2000 to 2025, using Domestic gross to define each year’s list. Box office and budget figures come from OpusData, Box Office Mojo and IMDb, converted to 2025 dollars throughout. This is deliberately a hits-only sample, because I was asked to respond to UCLA’s chosen focus. This means that any conclusions should not be automatically applied to the thousands of smaller releases each year - indie films operate very differently to the mainstream.
For each of the 8,854 individual people, I researched their background via public documentation, prioritising their own public statements, then interviews, official biographies and reputable coverage. Categories follow the convention used in the research this article engages with: White, Black, Asian, Latino, Middle Eastern and North African, Native American, and Multiracial, alongside gender. Each classification carries a confidence level and a note of its source.
When these sources could not reliably define the correct categories (i.e. 16.4% of people), I assigned working categories in two logged tiers. I reviewed photographs for 723 people alongside a second automated opinion and individually logged best guesses for the remainder. The blind double-coding, the 100 redraws and the two extreme scenarios described are how that guessing was priced; only findings that survive all of it are reported.
The UCLA team does not seem to have this problem (or at least they do not report it), as their tables carry a value for every person. Their methodology cites commercial casting databases (Gracenote Studio System, Luminate and IMDbPro) alongside their own research, and with a decade of accumulated records, institutional resources and the ability to contact people directly, they may genuinely have closed the gap that public records cannot close. The first edition of the report in 2014 allowed a person’s background to be “left blank if unascertainable”, but after that I can’t tell what happened to the unknowns.
I don’t like that I have any data gaps, so I dug a little deeper to understand if this could be skewing the results. I ran two sets of tests:
I re-researched a random sample of 242 people blind, twice over, to measure how often two honest attempts at the same person agree. For people with strong documentation, the answers agreed 94% of the time. For the middling cases, 74%. For the weakest, 57%. Those rates became probabilities, and I rebuilt the entire dataset 100 times, letting every uncertain person vary, and re-ran the headline models each time.
I ran the two most extreme scenarios possible, with every undocumented person assigned White, then every undocumented person assigned minority status. Whatever the truth is, it lives between those two brackets.
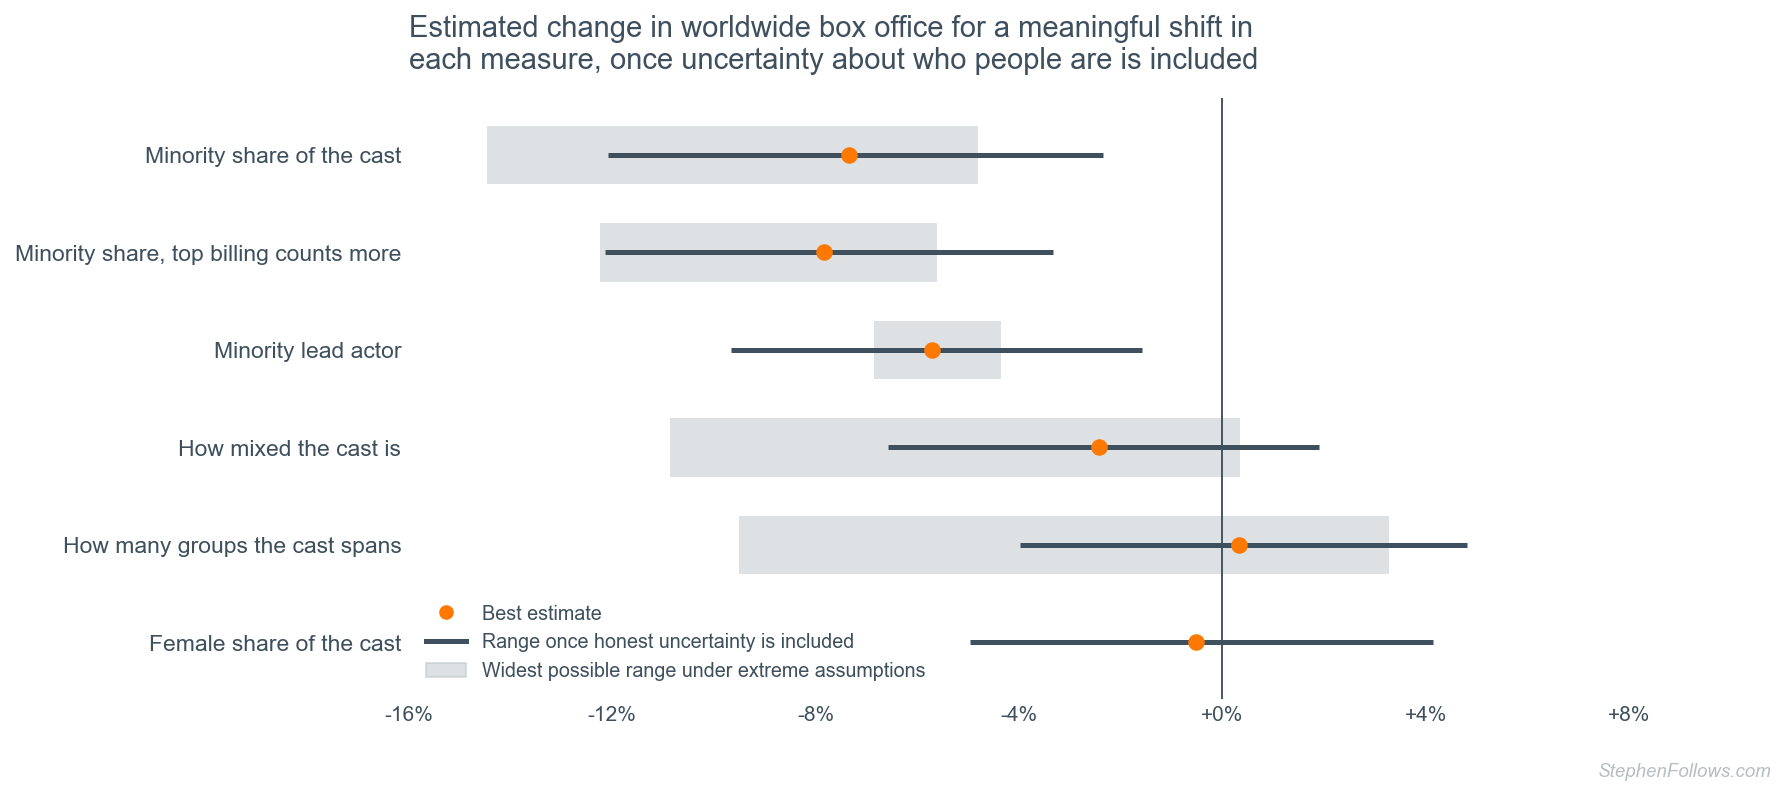
The result was that the error bars widen, the "more varied casts earn a bit more" signals dissolve into noise, and the small financing-shaped negative survives even the worst case. Most importantly, no assumption about the undocumented people, however extreme, produces a world in which cast diversity meaningfully lifts box office. So my handling of these 'unknowns' bothers me, but they do not change the conclusions.
For readability, I have been rather colloquial in the writing of the main article. For those who want the technical terms:
The Mix Score is a bias-corrected Blau (Gini-Simpson) index
Group Count is the exponential of Shannon entropy
The models are ordinary least squares on logged revenue with standard errors clustered by distributor, Poisson pseudo-maximum likelihood on real dollars, and quantile regressions at the median and 90th percentile
Controls are genre, creative type, franchise and sequel status, animation, release year and month, with production budget included in half the specifications by design
The uncertainty pass pools the redraws using Rubin’s rules
The extreme scenarios are Manski-style bounds. The 108 specifications were fixed before any results were computed.
Quotes and figures attributed to the Hollywood Diversity Report series are taken from the published PDF editions, 2014 to 2026, all of which I read for this project; the winning-band chart is built from their own published tables. I want to repeat the point that their team has studied this field far longer than I have, with resources and data access I do not have, and where our approaches differ it does not follow that mine is right.
This is a summary of the overall claims they have centred their research around each year:
[2014] Films with Relatively Diverse Casts Excel at the Box Office
[2015] Evidence from this report (and its predecessor in the series) shows clearly that America’s increasingly diverse audiences prefer diverse content created with the input of diverse talent. Diversity sells.
[2016] Consistent with the findings of earlier reports in this series, new evidence from 2013-14 suggests that America’s increasingly diverse audiences prefer diverse film and television content.
[2022] films with casts that were from 21% to 30% minority enjoyed the highest median global box office receipts, while films with casts that were less than 11% minority were the poorest performers.
[2023] New evidence from 2022 continues to support findings from earlier reports in this series suggesting that America’s increasingly diverse audiences prefer diverse film content in both theatrical and streaming releases.
[2024] New evidence from 2023 continues to support findings from earlier reports in this series suggesting that America’s increasingly diverse audiences prefer diverse content in theatrical film releases.
[2026] As found throughout this report series, new evidence from 2025 further demonstrates that America’s increasingly diverse audiences prefer diverse content in theatrical film releases.
I contacted all the authors and the appropriate UCLA Press liaison. I asked them to share their data and/or to have a chat with any of them (on or off the record) to better understand their data and methods, and to look for weaknesses in my work. Both were refused (albeit politely!).
The 29 studies in the field chart, classified by whether the analysis controlled for budget, genre and release factors.
Raw comparisons (9, all concluding diversity pays): the UCLA Hollywood Diversity Report series (counted once), CAA's Motion Picture Diversity Index (2017), the CAA/shift7 female-led films study (2018), the Geena Davis Institute reports (2016 to 2019, counted once), ReFrame (2025), McKinsey (2021), Vocativ (2014), Slated (2016) and the BBC's return-on-investment analysis (2018).
Controlled, positive (7): McKenzie (2010), Kuppuswamy and Younkin (2020), Zhong, Crema and Paserman (2024), Murray (2022), Nguyen (2023), Evans and colleagues (2024) and Valentowitsch (2023).
Controlled, no effect (7): Lindner and colleagues (2015), FiveThirtyEight's controlled result (2014), Yang and colleagues (2020), USC Annenberg (2023), Roth and McAndrew (2026), Hesslevik and Ramm-Ericson (2024) and Ravi (2025).
Controlled, negative abroad or split (6): USC Annenberg and ReFrame (2020), Pedace and colleagues (2019), Pattnaik and colleagues (2025), Giannetti and Chen (2023), Stroube and Waguespack (2024) and Fan (2021).
These classifications are mine, from each study's published method, with composite series counted once to avoid double-weighting.
As a side note, I do believe that advocacy research is perfectly capable of rigour. The most thorough controlled study in this field was commissioned by an advocacy group, and when its controls erased the famous claim that female-led films outperform, it published the null anyway. That study is "The Ticket to Inclusion" (2020), run by USC's Annenberg Inclusion Initiative and commissioned by ReFrame, the gender-equity coalition founded by the Sundance Institute and Women in Film. It modelled 1,200 top films with controls for production cost, marketing, distribution and genre, and found the gender of the lead made no significant difference to revenue in either direction, while also showing that female-led and underrepresented-led films were given smaller budgets and narrower releases. Passionate advocates for change are the main reasons we have anything nice in this world, and in many cases it's the ONLY thing the oppressed have on their side. My issue here is method, not mission.
Everything here is association, not causation. Casts are chosen, not randomly assigned, and no statistical method can fully separate a cast from all the other decisions a studio makes alongside it. The budget pattern is a description, not a claim about the 'true value' of a movie. Cheaper films may cast differently rather than diverse projects being given less money.
No work like this is truly objective, and what we count is shaped by who we are. I am a middle-aged CIS white man living in a Western capital city, classifying the public identities of thousands of people I have never met. I have tried to let people’s own public statements lead wherever they exist, to log every judgement call, and to report what breaks my conclusions as prominently as what supports them. Despite trying to be aware and sensitive to all points and lived experience, it’s more than possible I have made mistakes or assumptions. I would be very keen to learn of any, and will be delighted to correct them. Please do reach out to help me in this regard.
Finally, I would love for this to be part of a big conversation. I don’t seek to police what people think or say, but I would ask two things:
Be nice. We’re all humans trying to make sense of the same confusing world. Treat others with respect and grace, and I’ll back you if others fail to afford you the same courtesies.
Focus. This article’s comments section is not where we are going to settle big questions like “What is a woman?” or “Is [x] racism?” The internet already has myriad places for everyone to shout their views. Let’s keep this one about the facts and methods listed above.
Epilogue - the world of AI-powered research
This project would have been impossible for one person until very recently. The person-by-person research ran on AI models, with research passes with live web search to find and read interviews and biographies (with every claim carrying its source), a separate auditing pass by a second model checking that each classification matched its own evidence, batch photo checks against my own manual review of around 650 photographs, and in-session research agents for the hardest cases.
The classification machinery ran over a handful of days and cost roughly $480. So a HUGE thank you to my paying subscribers who make this kind of research possible.
A decade ago this would have been a research team working for months. The Hollywood Diversity Report is what that fuller version looks like. It is a standing university research initiative with dedicated staff, commercial data subscriptions and, per its own acknowledgement pages, financial support from UCLA's Division of Social Sciences alongside sponsors including Netflix, the Golden Globe Foundation, the Latino Film Institute, Disney and Hulu. The report receives public money, too, in the form of a $250,000 allocation in California's 2021-22 state budget, and a $1.5 million state investment announced in 2022.
That money buys real things my $480 cannot, such as institutional memory, professional researchers, direct industry access and the ability to do this every single year.
When I started my journey into film data 15 years ago, I was 100% hand-coding and using Excel spreadsheets. As the tools have expanded, I’ve been able to operate at larger scales and in ever-increasing detail. That said, if you would have told me even a few years ago that a project of this depth could be done in just a few days by myself, I would have thought it fanciful.
While this is genuinely thrilling, it comes with limits worth naming:
An AI pipeline applies my judgement calls at scale, including any I got wrong.
It lacks the domain memory of researchers who have lived in this field for years.
Its consistency is only as good as the auditing conducted on it.
So I’m not saying ‘one person with AI beats an established research team’, but just that it is amazing how close one can get alone.
Fascinating work. Thank you for sharing this. I have been working on diversity in video games and agree with the many challenges!
This may be your most complex and interesting study yet. Congratulations.