


Over the last year, I have been working with top film financier Phil Hunt to better understand how the world of movie money actually operates. We’ve taken our time, gone deep, and come out the other side with an in-depth understanding of the opaque world of film financing.
One question Phil gets asked a lot is:
What does the typical film finance plan look like?
So we put our heads together to answer it. Phil provided his knowledge and experience, and I dug deep into the numbers. I gathered the official finance plans of 4,324 European fiction films (2016-23) and added the breakdowns published by seven national film bodies. I then compared them with a whole load of finance plans I have privately.
If you want to hear Phil and I talk about film finance, then we have a webinar coming up in early December you can sign up to for free:

How does the plan change as the budget grows?
For the clearest picture of how budget size changes a finance plan, I started with the e European Audiovisual Observatory. It coordinates national film agencies to combine their data and splits them into six budget bands.
The chart below shows the 485 films released in 2023 that they tracked, excluding French films (I'll come to France in a moment).
As budgets rise, public money rises too, then falls away. Under €500,000, films got 32% of their money from public funds. At €500,000 to €1m they got 48%, but by €10m to €30m, it fell to 8%.
Sales follow the opposite trend, rising from nothing at the bottom to 29% at the top.
For the lowest-budget films, the biggest single source is ‘producers and private investors’, at 38%.
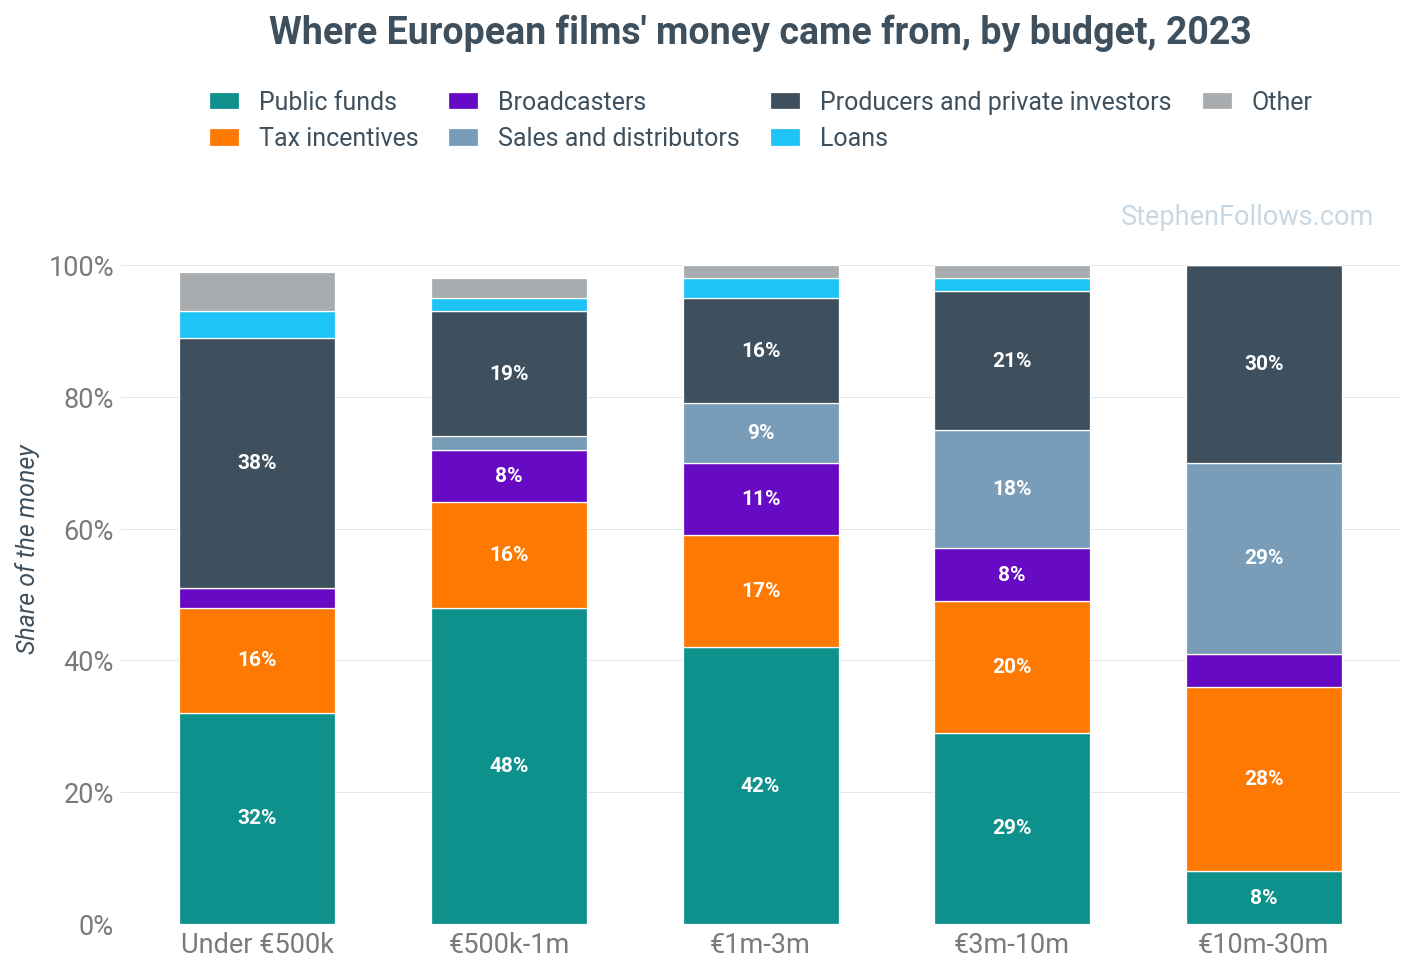
Interestingly, tax incentives are fairly consistent across the budget spectrum. They account for 16% to 20% of the money across the four bands up to €10m, and 28% above that.
One note on this data: Europe's agencies largely have the granular detail for the films they helped pay for, which excludes bigger, purely commercial productions. Even the Observatory warns that this probably overstates the role of public money.
Are tax incentives replacing public funds?
Let's zoom out from one year and look at a time series, because a trend is emerging beneath the surface. Across these 2,490 European films (2016-20), public funding fell from 29.4% to 24.0%, while production incentives (tax credits, rebates, and tax shelters) rose from 9.6% to 17.8%.
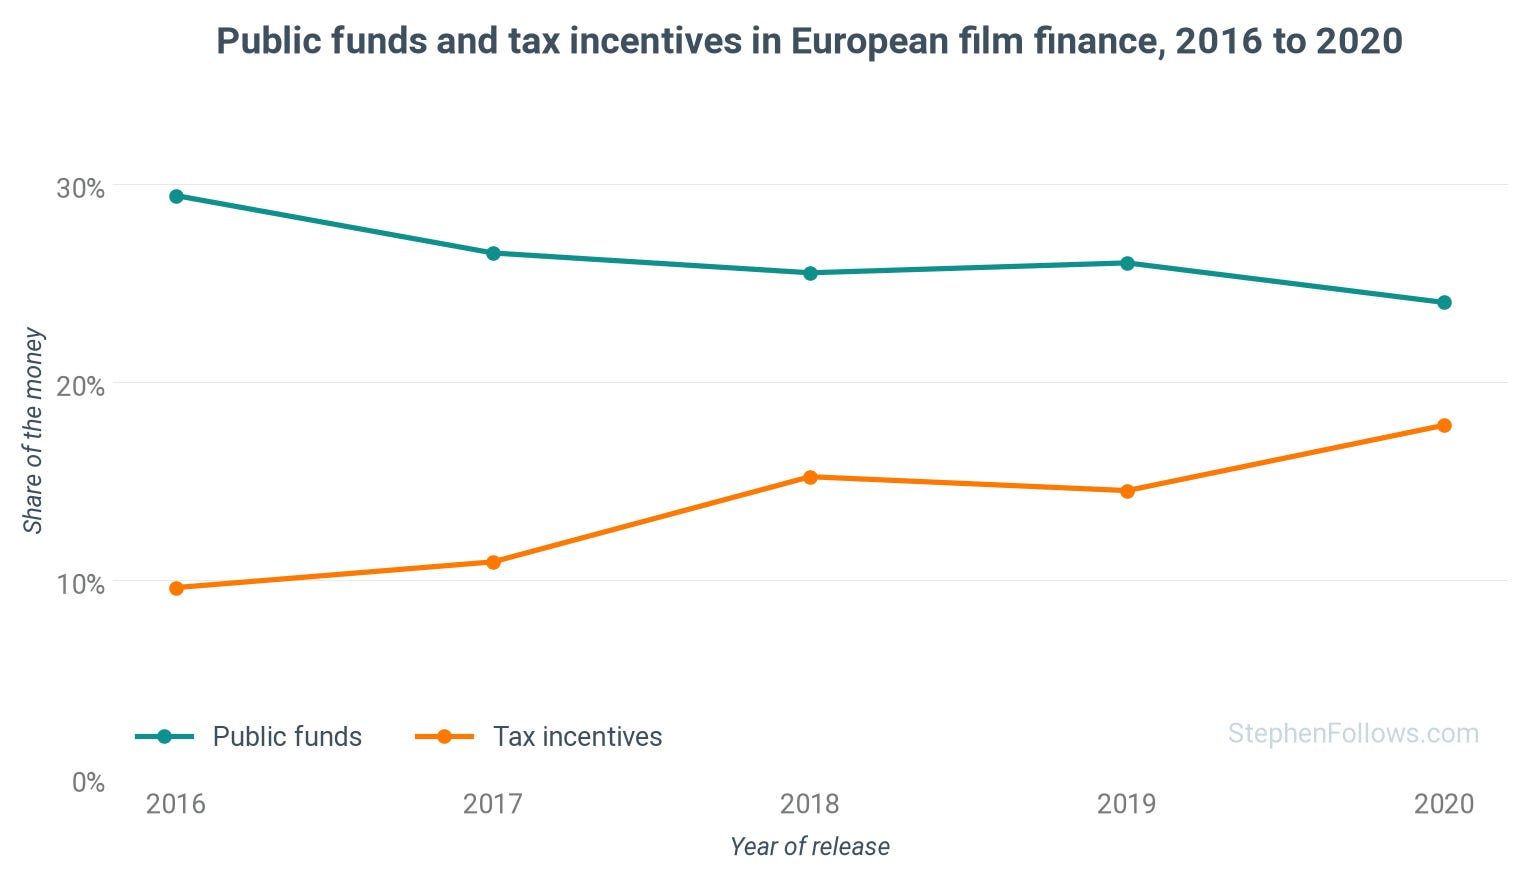
The difference between these two types of public funding matters for two big reasons:
Accessibility. A grant is a decision someone makes about your film. You may need a certain type of project or have to please/appease a particular set of gatekeepers.
Timing. Incentives are paid out against pre-defined, open criteria (rather than someone picking you) but typically arrive after spending, so you may have to borrow in the meantime.
Why does France look so different?
French films are a different case, as television pays for them. Fortunately for us, France's national film body (the CNC) publishes the financing of every French-initiative film it certifies.
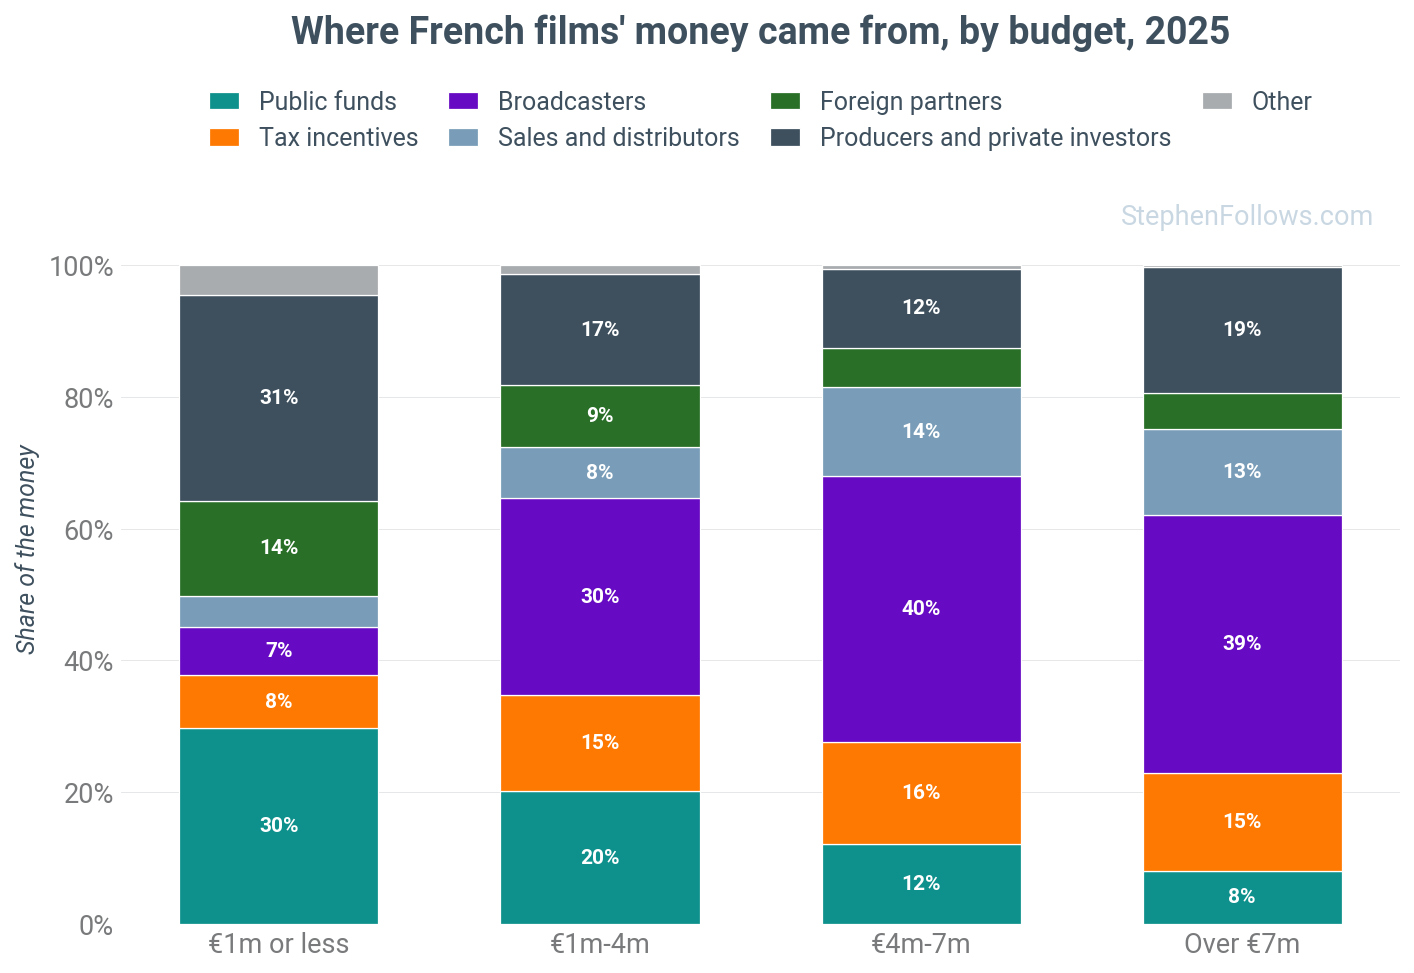
In 2025, broadcasters (which include streamers) paid for 36% of the money behind 216 French films. For contrast, across the other five countries I looked at, the median is 8%.
For films costing €1m or less, broadcasters paid 7% and public funds 30%. From €4m upwards, broadcasters paid around two-fifths of the money and public funds 8% to 12%.
The bigger the French film, the more of its money comes from television.
What does a real closing plan look like?
So far, the figures are for movies the public bodies know of, and look back at completed movies rather than taking the perspective of a commercial producer trying to assemble a new project.
When Phil and I looked into it more deeply, we discovered that many producers have a slightly different journey when seeking finance. The two biggest differences were:
Complexity. The median plan for a film costing $1m to $5m listed nine separate sources of money.
Advancing tax credits. If a film gets made with 20% of its financing coming from a tax rebate, then the public bodies usually classify that as a ‘tax credit/. However, if you are the producer making that film, then, based on the data we have, about a third of the money (35% in the median plan at $1m to $5m) came in as a loan, usually advanced against that tax credit or a sale. So it’s both true to call that money ‘Tax credit’ and ‘Borrowing’.
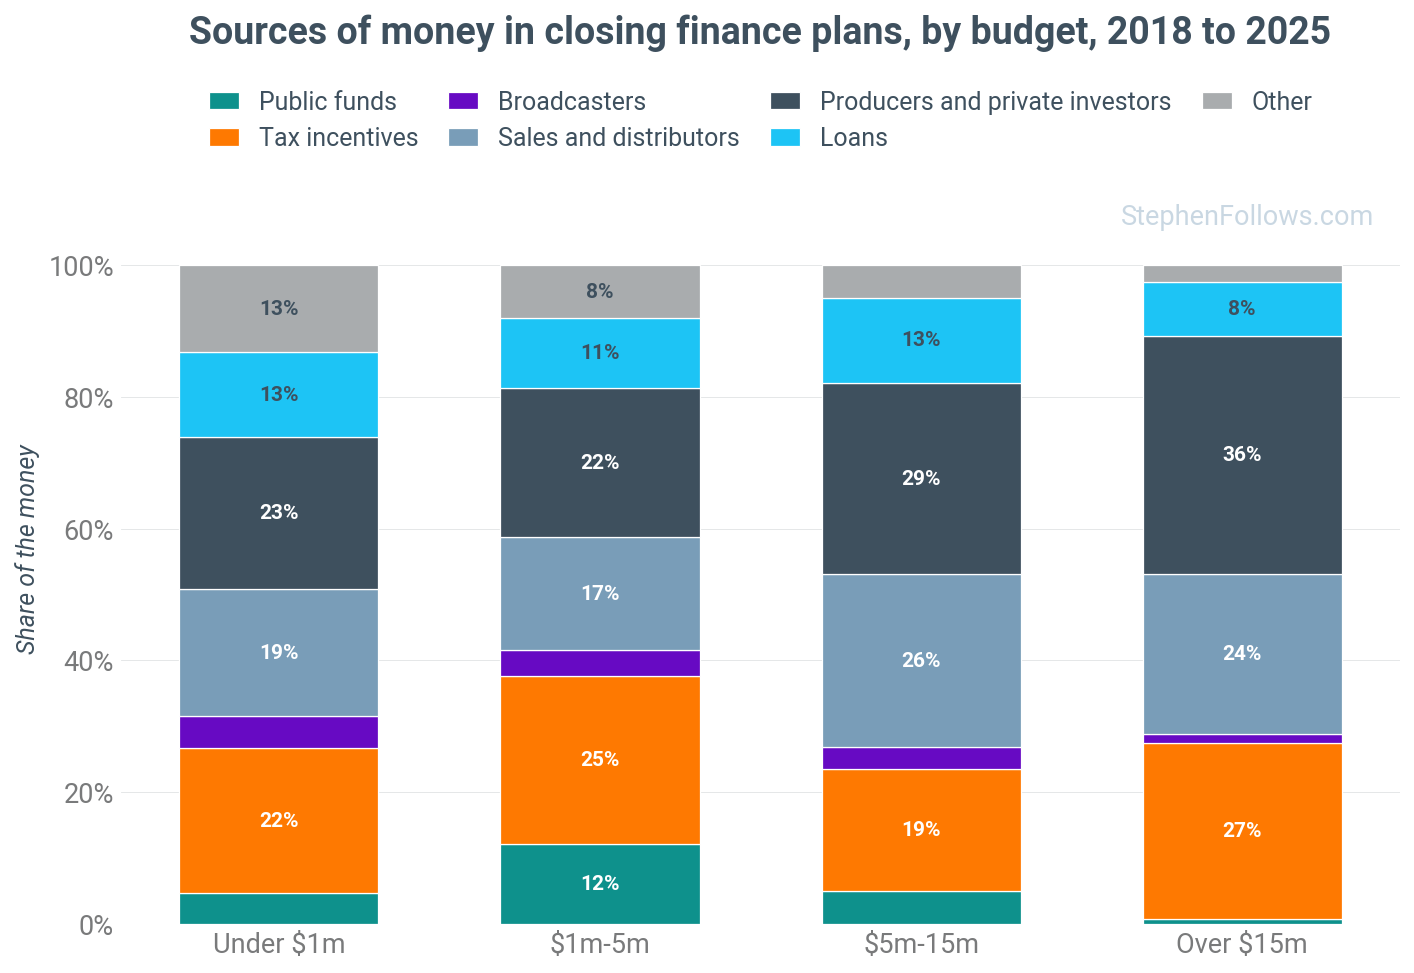
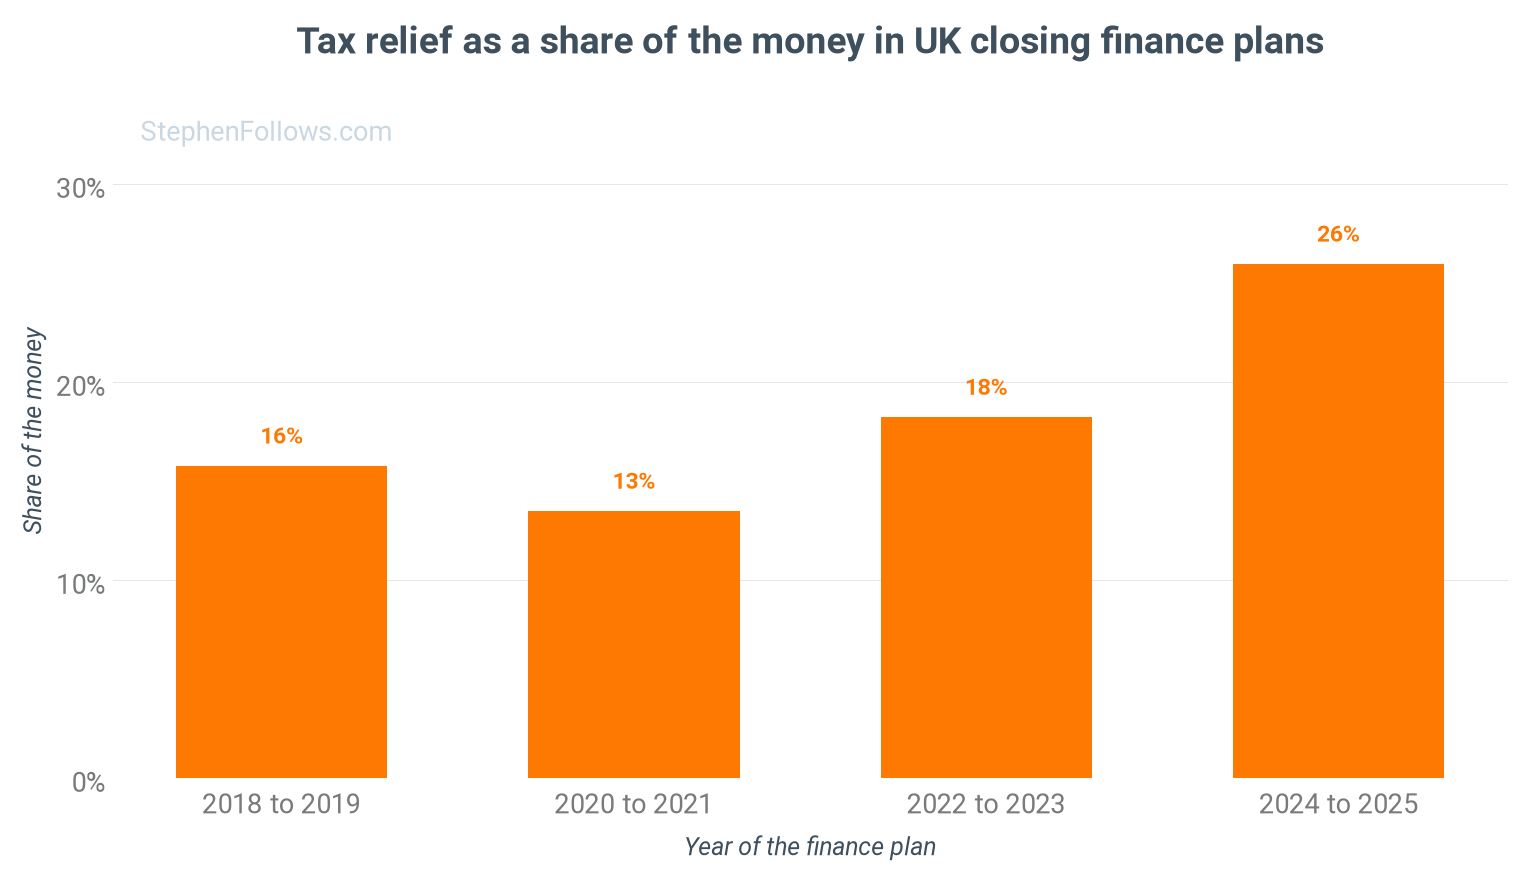
The UK is a good example of how quickly one rule can change the situation for producers. The new Independent Film Tax Credit covers British films with core spending of £23.5m or less that started shooting from April 2024, and pays 53% of qualifying spend, counting up to £15m of that spend.
British producers quickly took up this generous and accessible scheme, as you can see below.
More money from the credit doesn't automatically mean more films. In July, the UK training body ScreenSkills published a report on the state of UK production which said:
The Independent Film Tax Credit (IFTC) has provided a modest gain to the landscape with a significant increase in scripted film announced in the UK ... However, it remains to be seen whether these additional titles will enter production and contribute to UK production activity.
Australia leans even harder on its tax incentive. In the 32 Australian plans at $1m to $5m, incentives paid for 33% of the money. Screen Australia's own figures put the Producer Offset at 34% of all the finance behind Australian features in 2024/25.
How do countries compare?
Six of the seven national film bodies I looked at publish breakdowns (their categories don't line up perfectly, so check the Notes at the end of the article for details, but the overall picture is sound).
In four of the six, the state is the biggest backer when you add public funds and tax incentives, from 40% in Sweden to 60% in Canada. The exceptions are France, where television pays more, and Finland, where foreign partners do (40%).
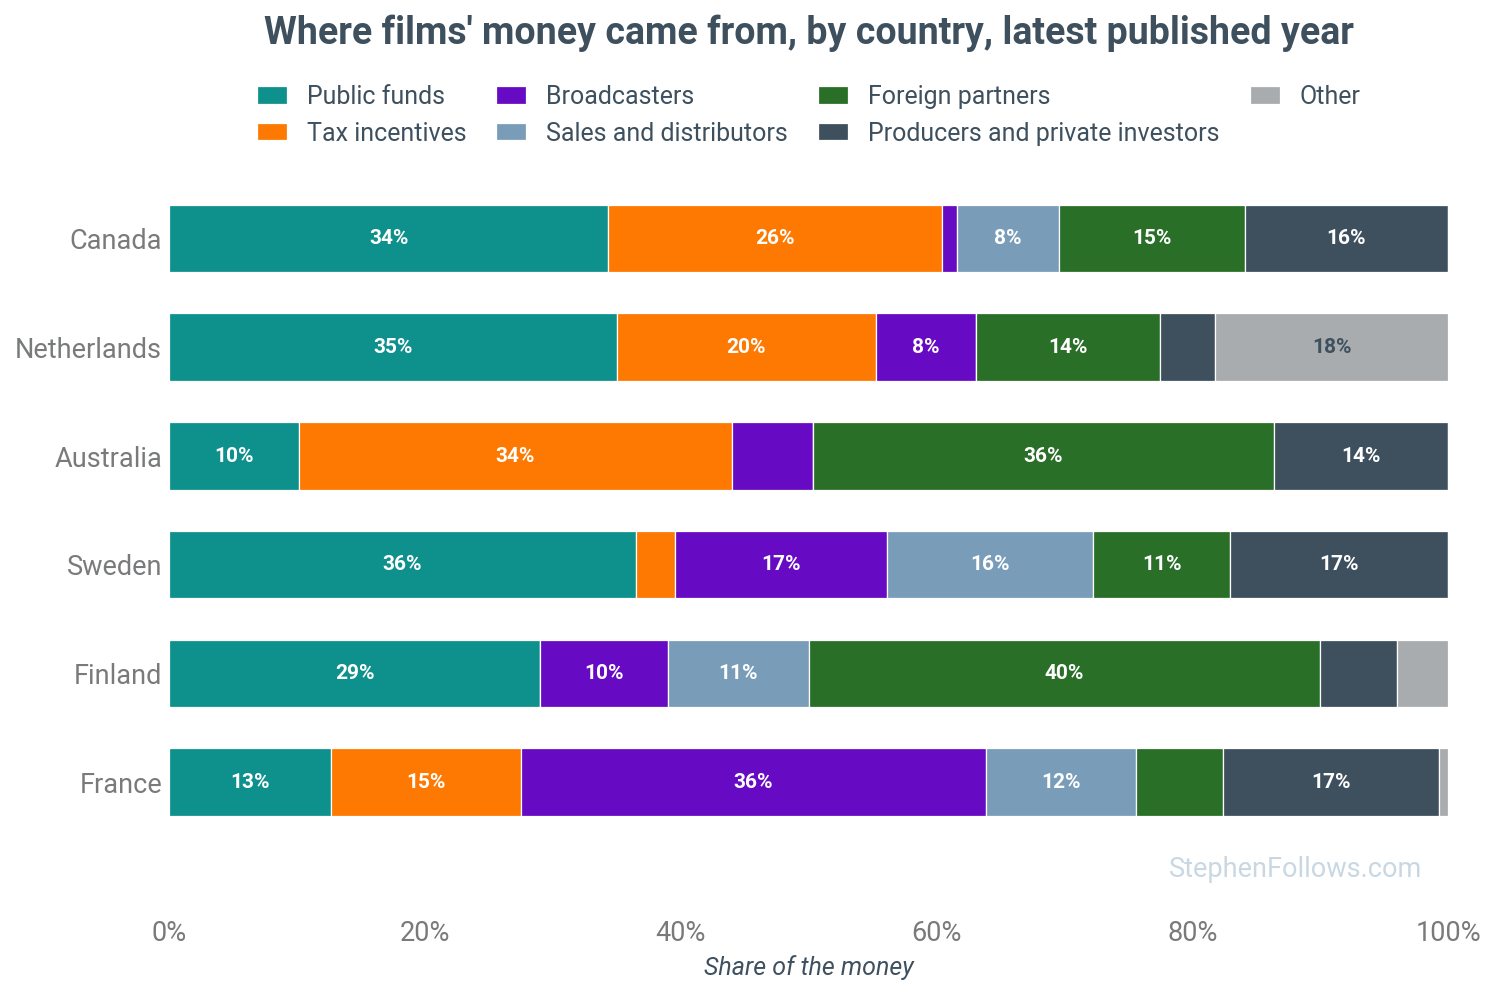
What producers and private investors put in is small everywhere, from 4% in the Netherlands to 17% in Sweden and France.
Italy reports it differently, but its 2025 figures for 317 films point in the same direction. There, the production tax credit that producers applied for came to 33.3% of the money, the biggest single line in the plans.
What about American films?
There is no American body which publishes anything like this. US independent films rarely get public money in the European sense, so nobody collects the data.
In 2014, I surveyed over 1,000 people who had been to Cannes, Berlin, or AFM about where the money came from for the films they'd worked on over the previous two years.
Among the 224 people based in the US, private money came out on top, whichever way I counted the answers, at around 46% on average.
After that came tax incentives at about 14%, pre-sales at about 12% (plus 4% from TV pre-sales), and the studios, grants and crowdfunding at under 10% each.
For people working mostly on films under $1m (104 of them), private money rose to 53% and crowdfunding to 12%.
Those figures are people's own estimates, and they're from 2012 and 2013, before streamers were paying for films at scale. But they fit what the public filings show.
One of the clearest is My Dead Friend Zoe, a film with about $4.5m before incentives that raised money from the public and therefore had to report it to the Securities and Exchange Commission. Its annual report shows $2,259,000 from private investors, $777,075 more from investors through Wefunder and another $773,954 in small equity investments from the crowd, plus about $700,000 back from Oregon's production rebate.
Roughly five-sixths of the money was equity.
In the US, the soft money is mostly state tax credits. Take California, where the credit for independent films of $10m or less came to 25% of qualifying spend for the 70 projects approved from 2020/21 to 2024/25, and about 35% for those approved in 2025/26.
Because qualifying spend excludes most of the cast, director, and producer costs, the share of the total budget is lower. A federal credit of 20% to 30% of qualifying wages was introduced in Congress in September, but for now it's only a bill.
So is there a typical plan?
No, there really isn't.
If you tell me a film's budget and its country, I can tell you roughly where most of its money came from.
If it's a €700,000 European drama, it's mostly public money and the producer's own side.
In France, at €5m, two-fifths comes from television.
In Britain, an independent film now gets about a quarter of its money from tax relief.
In the US, private investors carry far more of the load than they do anywhere in Europe.
What the averages can't show is the order in which the money arrives, the conditions attached to each piece and the sums a lender does before saying yes. That's what decides whether a plan actually closes.
On 8 December, Phil Hunt (who lends to and invests in independent films and has financed over 600 features) and I will take a real finance plan apart line by line, live, in a free webinar. If you're putting a plan together for 2027, I'd love to see you there.

Notes
The European figures come from the European Audiovisual Observatory, which analyses the financing plans that national film agencies hold for live-action fiction films with a theatrical release, either 100% national films or majority co-productions. I used its overview of films released in 2016 to 2020 (2,490 films from 18 countries) and its reports on films released in 2021 (448 films), 2022 (713) and 2023 (673, of which 485 were not French).
In its figures, each share is of the total money in a budget band, so larger films weigh more. I grouped its categories into the chart's seven, with producer investments and private equity under producers and private investors, and in-kind and other money under other. Because the Observatory rounds to whole numbers, some bars add up to 98% or 99%.
Its samples cover only films whose agencies hold a plan, about half of all European fiction releases, and they lean towards films with public support. The country mix also changes from edition to edition, so the 2016 to 2020 trend comes from the overview, which used the same 18 countries throughout.
For France I used the CNC's open data and 2025 production report
For Australia Screen Australia's sources of finance data for 2024/25.
Canada's figures are in Exhibits 4- 7 of Profile 2024, covering 117 certified theatrical features in 2023/24.
The Dutch figures are from the Film Fund's Film Facts and Figures 2024 (34 films).
The Swedish from the Swedish Film Institute's Facts and Figures 2024 (19 films).
The Finnish from the Finnish Film Foundation's Elokuvavuosi 2025 (19 films).
Italy's are from the Ministry of Culture's I numeri del cinema e dell'audiovisivo italiano 2025, where the tax credit is the amount producers applied for, and producers, broadcasters, and streamers share one line.
Each country counts a little differently.
Australia reports broadcasters and distributors together.
Canada counts broadcasters' equity investments as private money, so its 1% for broadcasters understates them.
The Netherlands counts minimum guarantees and streamer money under other national funding (18%).
Sweden and Finland cover only films their own funds supported.
Finland has no line for tax incentives.
I left out Belgium's Wallonia, whose figures include films where Belgium is only a minority partner.
None of these tables covers American studio films shot in the country.
My 2014 survey ran from 5 to 29 January 2014. It asked, ‘On average, for the films you have worked on in the past two years, where did the financing come from? Each of its seven sources was answered in bands (0%-15%, 16%-30% and so on), and the answers didn't have to add up to 100%. I took the middle of each band, scaled each person's answers to 100% and averaged them. Counted other ways, private money ranges from 40% to 59%.
The 224 US respondents were connected to the US and had attended Cannes, Berlin or AFM. Their films include shorts and documentaries, and the answers describe what people reported about the films they worked on. California's figures are the credits allocated when projects were approved, as a share of qualified spend, from the California Film Commission's approved projects list as it stood on 18 August 2026. Projects that later withdraw drop off that list, so its counts for 2025/26 change over time.