 Acting is a strange profession, with many contradictions.
- The job officially requires no qualifications but actors are expected to train to a high level in a wide variety of skills.
- Good actors convince audiences that they are the character (rather than an actor pretending) and yet top actors have loyal fanbases keen to see the specific actor who’s doing the pretending.
- It’s nominally a meritocratic industry but most successful actors are coincidentally thin and attractive with great hair.
As regular readers will know, I have recently built a dataset of all working actors in the UK using data these performers have published about themselves in their professional profiles. Today, I thought it would be interesting to look at how the pool of professional UK actors compares to the UK population.
I narrowed it down to five topics:
- Age
- Location
- Ethnic appearance
- Whether they can drive
- The languages they speak
For each of the topics, I have sought out the best source(s) of data on the UK population that I could find. However, they are not perfect matches to my actors’ dataset, with some being for limited regions (such as just England) and over different time-periods. I have added details of all the datasets, sources and methodologies at the end of this article.
1. Age
Only one in five adults living in England and Wales are under 30 years old, whereas 55% of UK actors have their mid-playing age set at under 30 years old.
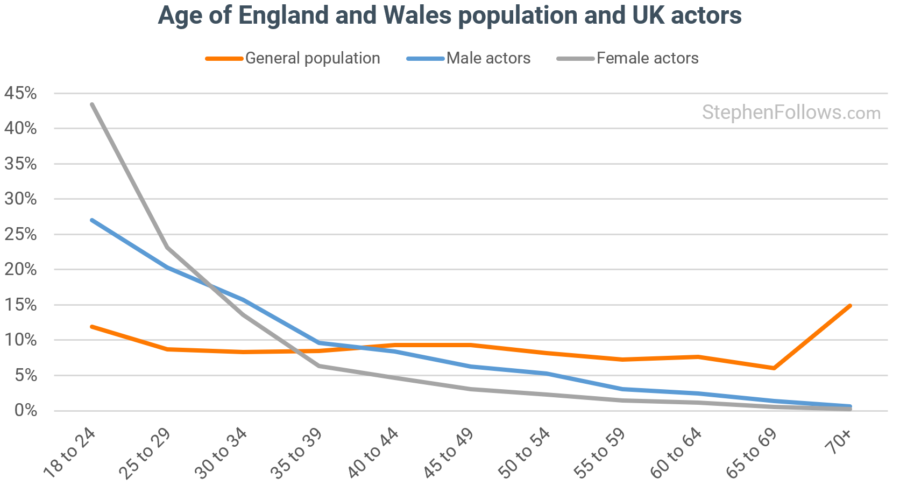
I have previously studied the age of actors in more detail (Is acting a profession dominated by the young?) so it’s worth heading over to that article if you want to know more about the complexities of studying the age of actors.
2. Location
13% of the UK’s population lives in London, whereas a whopping 63% of actors are based in London.
At least three-quarters of all UK actors live in just ten cities – most in London, followed by Manchester, Glasgow and Birmingham.
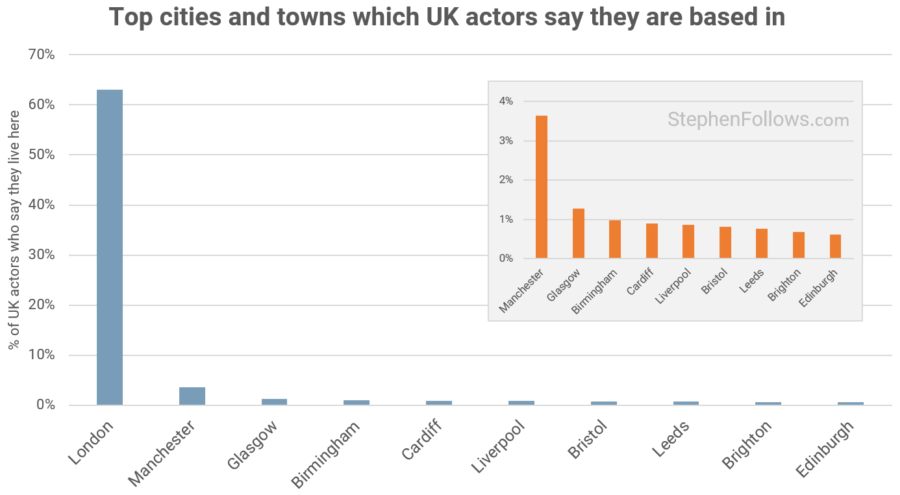
This London-centric pattern is found across all areas of the film industry, other than exhibition. I looked at this four years ago in an article entitled How much of the UK film industry is based in London?
3. Ethnic appearance
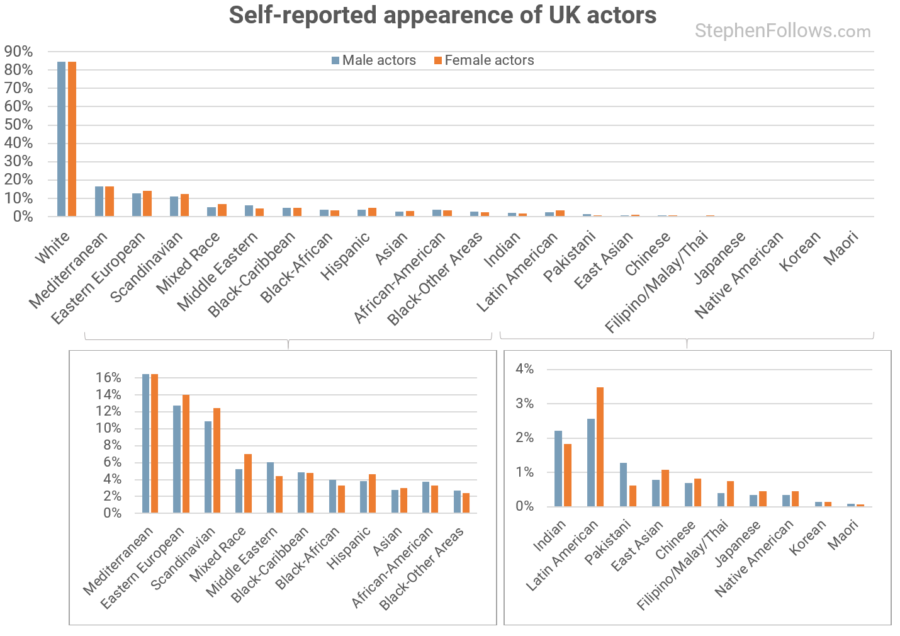
Race is a complicated issue and not one I can directly address in today’s research. However, we can look at a couple of related topics via two proxy datasets – the 2011 census for England and Wales and my actors’ database. They don’t quite overlap but I wanted to include them nonetheless as I think they can give us a hint as to which types of actors are over- or under-represented when compared to the general population.
In the 2011 Census for England and Wales, 86% of people identified as “White”, 7.5% as “Asian”, 3.3% as “Black”, 2.2% as “Mixed” and 1% as “Other”.
85% of actors say they can play “White” roles, 6% can play “Black” roles and 6% “Mixed”.
4. Driving licenses
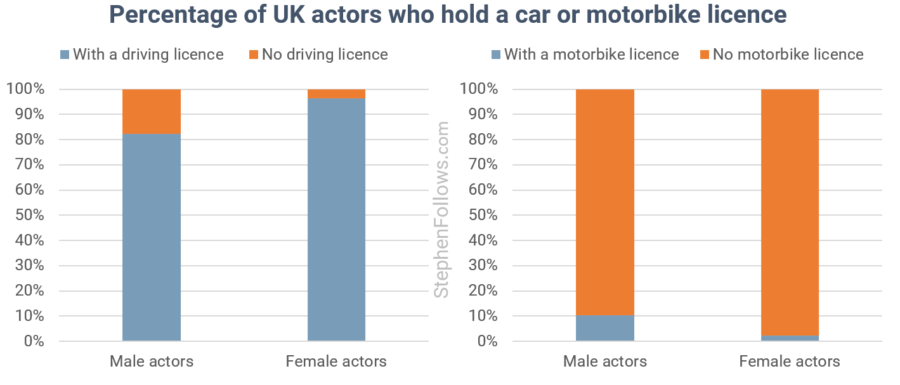
Actors are far more likely to hold a driving license than the general population. 89% of actors can drive a car, compared with just 74% of the English.
Female actors are much more likely to be able to drive a car than their male counterparts (96% versus 82%, respectively). This is the opposite of the pattern seen with English citizens, whereby men are much more likely to hold a driving licence than women.
5. Languages spoken
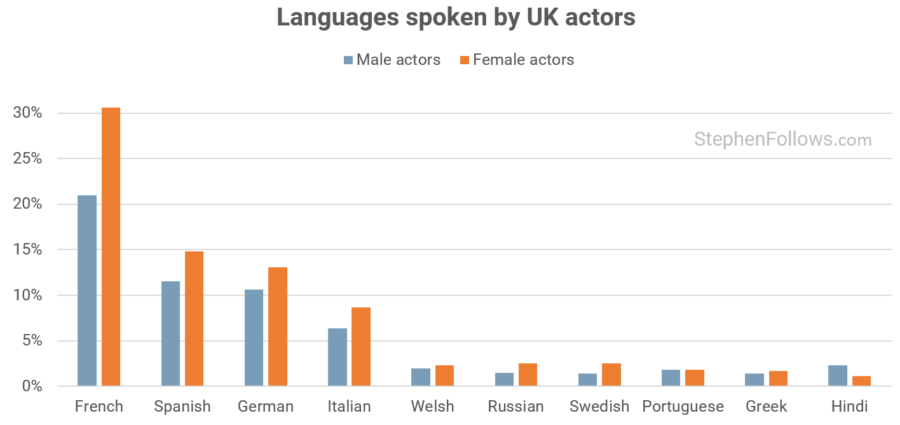
Actors are more polyglottal than the average UK resident. 15% of UK adults can speak French, compared to 27% of actors (with female actors almost 50% more likely to speak French than male actors). The same can be said for other languages such as German (6% of UK adults and 12% of actors), Spanish (4% of UK adults and 14% of actors) and Italian (2% of UK adults and 8% of actors).
Notes
I built my database of actors from a number of public sources including Spotlight, Equity, Mandy / Casting Call Pro, Wikipedia and actors’ own websites. I was helped by a couple of key facts:
- The vast majority of actors need to have a public profile of some type. Most UK actors have a Spotlight page as Spotlight acts as the industry’s de facto indicator of an actor’s professional status and is a trusted source for actor CVs. The most famous actors don’t tend to keep their Spotlight page up to date and some take it down altogether. But this accounts for a small number of performers. At the other end of the spectrum are those actors who do not have the required experience, or who cannot pay the ~£150 annual fee, to keep an active Spotlight page. But if they are looking for work then it’s extremely likely they will have a profile on at least one of the other sites I used as sources.
- Each actor has a unique stage name. The UK actors’ union, Equity, requires that all performers have a unique stage name which they use across their professional career. Not only can a new performer not use the name of an existing, active actor but they cannot even use subtle variations (i.e. adding a middle name or initial, hyphenating, etc). The only exception is when an actor retires (and/or stops renewing their professional presence, such as on Spotlight) at which point their name is up for grabs again. This quirk of the acting business allowed me to mix data from a number of sources for the same performer, enriching the dataset and preventing double counting.
A few caveats are needed on the data, including:
- I built this dataset last year (2018) but it has taken me a while to get to the number crunching. As this is a study of actors aged 18 or older, there are a handful of 18-year-old actors right now who are not included. Plus it will include actors who have retired extremely recently.
- This is self-reported data which actors have chosen to reveal publicly in order to help them get hired. Therefore, there are a few layers of artifice which could mean that the numbers differ from reality. For example, I wouldn’t be shocked if some actors claim that they are slightly taller, younger or more talented than they actually are. It’s also possible that actors have not kept their profiles up to date as they learned new skills, changed their appearance or as they aged.
Each of the sources provided different data points. If the same actor appeared within multiple sources then I gained a detailed and rich picture of their professional profile. However, if they only appeared in one or two, then I may not have data for some of the topics I studied. Therefore, the percentages shown above are for actors whose data I had on the topic in question.
For brevity’s sake, I did not include all the caveats within the body of the article, and so here are a few extra details and footnotes to each topic:
- Age. Population data comes from the 2011 UK census. Percentages are of adults (i.e. 18 or older). Actors’ ages are the middle of their playing range.
- Location. The UK data is from the ONS for 2017. It’s worth noting that a small number of actors choose to state a region, rather than just one town or city. This means that the figures above are probably slightly under-representations of each city.
- Ethnic appearance. Population data comes from the 2011 UK census. Race can be a complicated and contentious issue. In today’s work, I am comparing two subtly different things. The ONS is asking people to self-identify into just one of 18 standardised ethnic categories whereas actors are being asked which “appearance(s)” could they “believably be cast as” (and are allowed to select more than one option). In short, the ONS is asking “Who are you?” whereas the actors are declaring “I look like…” This means that today’s data shows how well the UK pool of actors can portray the UK population, rather than how their backgrounds compare.
- Driving licences. The data comes from the National Travel Survey and relates to people aged 17 years and over in England in the period from 2013 to 2017.
- Language. UK language data is from the British Council, who conducted a YouGov poll in 2013 of 4,171 UK adults. Fieldwork was undertaken between 1st – 4th October 2013. The survey was carried out online. The figures have been weighted and are representative of all UK adults (aged 18+).
Epilogue
Given the volume of caveats and notes, I hope it’s clear that this is not a perfect comparison. Despite this, I think the answers give an indication that actors are expected to hold more skills than the average person and that they have stiff competition.



Comments
I guess we should be careful about whether the data on ethnicity can be related to representation in films. It is one thing to say that x% of “actors with a profile” are ethnicity x compared to the general public but it is quite another to try to figure out how many of that ethnicity were in leading/support/small/token roles. And yet another to rank the films they were in according to budget. Its probably not surprising that the population of actors somewhat matches the general public. It’s also my gut suspicion that a lot of ethnicities are not getting a proportional amount of quality work.
congratulations on a fascinating site by the way