
I was contacted by a reader who asked whether “female audiences respond more positively to feature films that have at their heart a female creative team? In particular, a female director and writer“.
It’s a fascinating question as it speaks to the significance of the creative voice(s) behind films and how they connect with us as viewers.
One of the (many) reasons why I believe passionately about equality of opportunity is that if we preordain that only one group of people get to control the creation of our shared stories then we rob everyone of interesting perspectives. The people who share that point of view lose the chance to see themselves on screen, and the rest of us lose the chance to see the world through someone else’s eyes.
So I turned to the data to see if we can discern any connection between the film women make, and the film woman chose to watch.
I used data on 1,733 movies released in UK cinemas between 2000 and 2021, for which I have both audience gender data and filmmaker gender data.
Let’s start by looking at the gender of both sets of groups – film creatives and film audiences, and then see how preferences differ.
What is the gender split among cinema audiences?
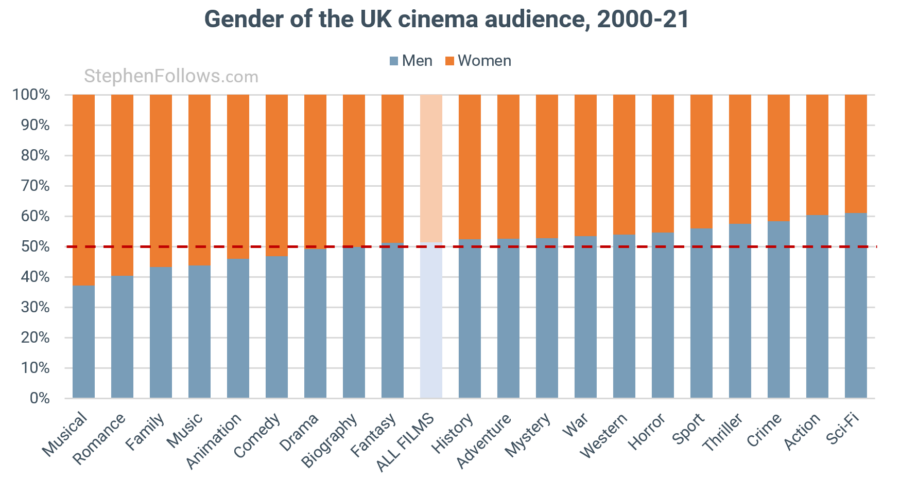
According to the UK 2021 official census, the UK population is made up of 51.0% women and 49.0% men. This near parity is very similar to that of UK cinema audiences over the past two decades, as shown below. 51.5% of cinema-goers surveyed identified as men.
Women were slightly more lightly to watch musicals and romance films, whereas men were slightly more likely to attend action and sci-fi movies.
It’s worth observing that the gender skews are a lot milder than is often portrayed within the industry and popular culture. There are no “male genres” or “female genres”, albeit individual films can have a more extreme skew than these averages.
What is the gender split of people behind those movies?
The picture among film creatives is less equal.
The people behind the same movies the audiences above were watching, we discover that 20.8% of producers were women, 10.8% of writers and just 6.4% of directors.
Comparing the people who make and watch movies
By combing these two sets of data, we can look at whether there is a link between the films people choose to watch and the gender of the people behind them.
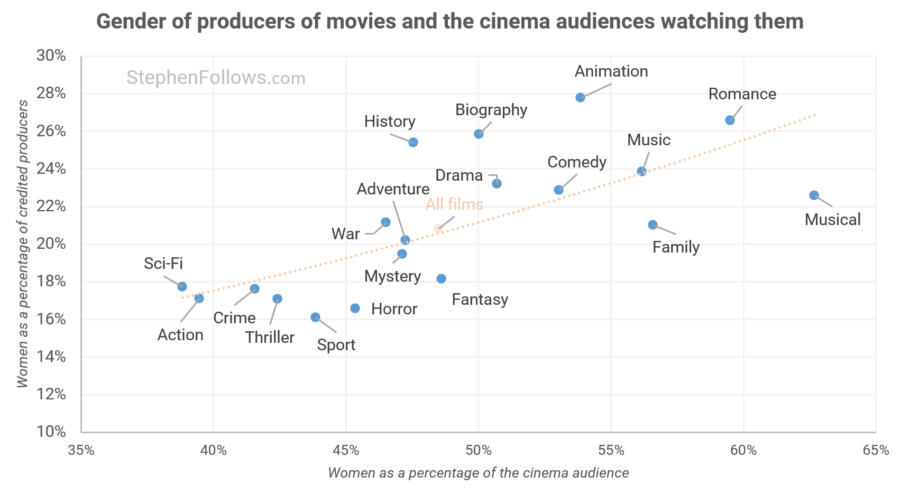
We’ll start with producers as that had the highest representation of women.
The scatter plot below has the percentage of women within producers on the left and the gender of the audience at the bottom. Each dot represents the average for that genre.
The orange trend line shows us that there is a correlation, across all the genres. The films with the highest percentage of women in the audience are also those with the highest percentage of women producers.
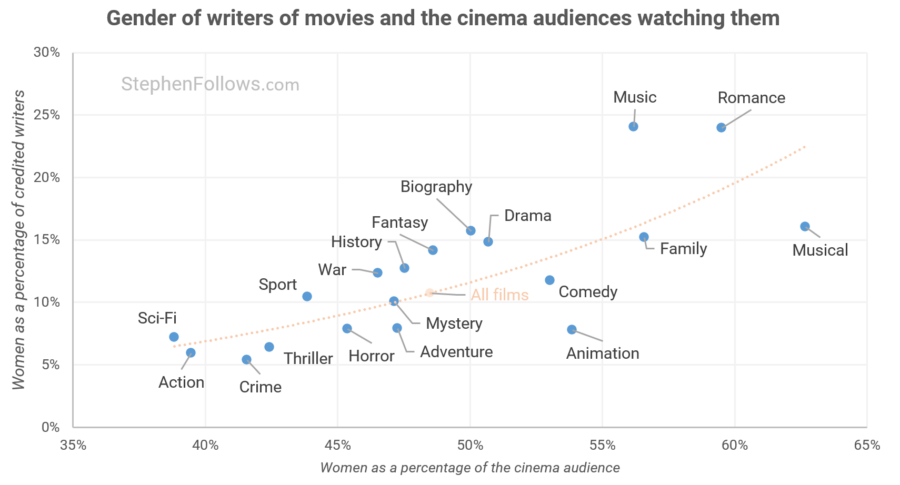
The picture is very similar for screenwriters, both the overall trend and which genres we see at either end of the spectrum.
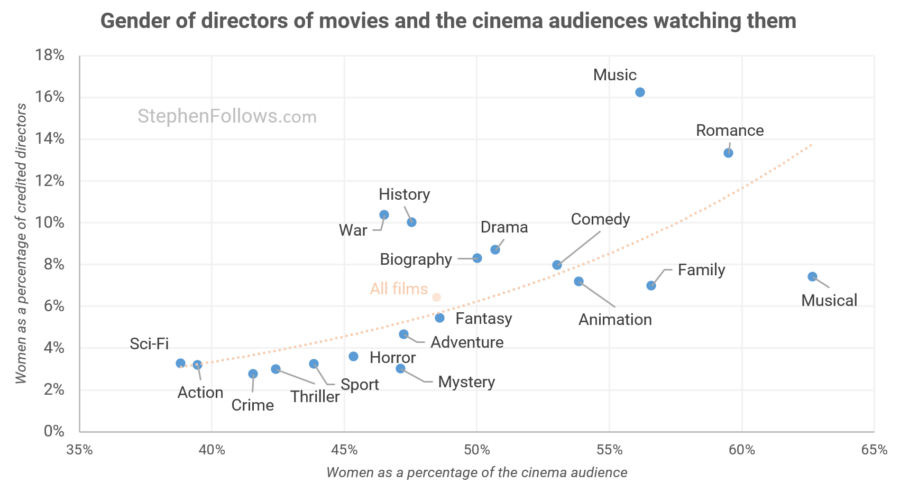
And finally, let’s turn to directors. Here we see the same pattern repeated yet again.
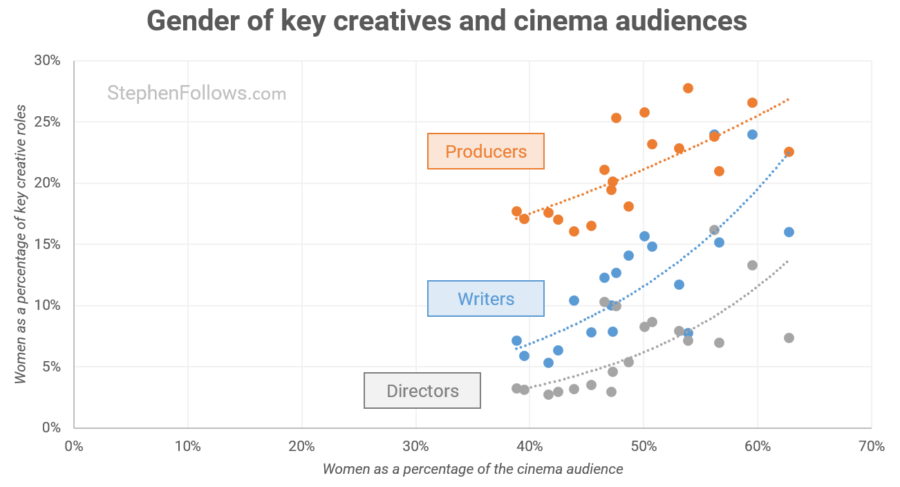
I thought it might be helpful to see those three datasets presented on the same plot. Below is the same data, but without genre labels due to space.
This reveals that the effect is most pronounced among writers.
The effect of women creatives
Finally, let’s look at how the audience changes when we see at least one woman at the helm.
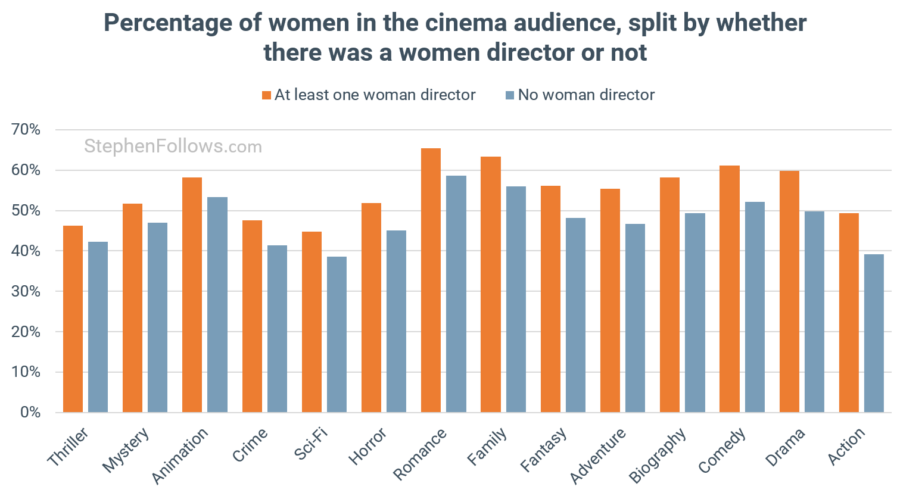
The chart below shows the percentage of women in the audience, split by whether there was a woman directing or not. The genres are sorted, with the biggest difference to the right. In all genres, having a woman director is correlated with a greater number of women in the audience.
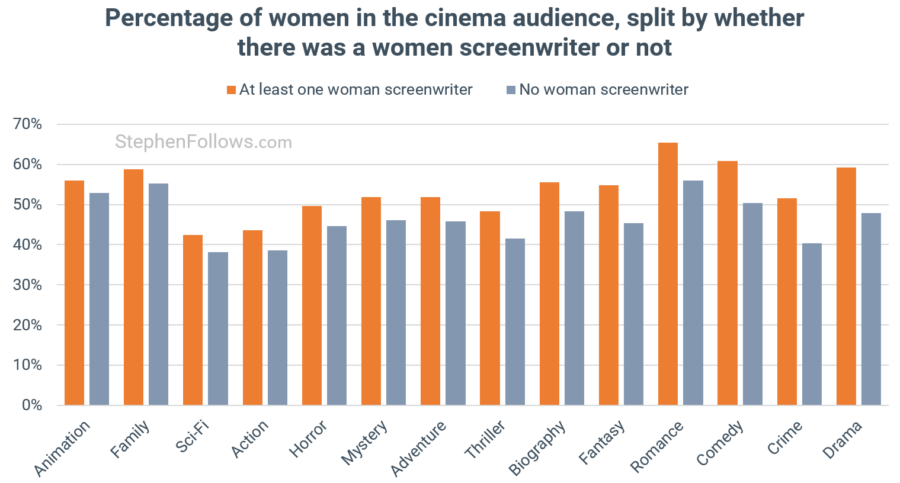
It’s the same for writers…
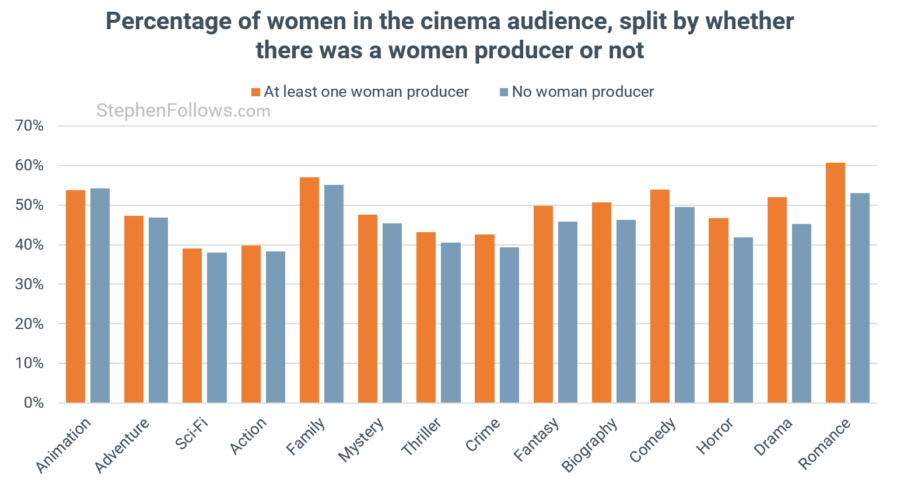
… and producer, albeit with Animation being the one outlier where the audience was 53.9% women when there was at least one women producer and 54.2% when there wasn’t.
So there you have it – the data suggests that there is a correlation between the gender of film creatives and the gender of the audience. Films with a higher percentage of women in creative roles, such as producers, writers, and directors, tend to have a higher percentage of women in the audience. This is especially pronounced among writers.
However, it is essential to remember that correlation does not imply causation. There could be other factors at play, and individual preferences may vary greatly. Also, the data here is based on averages and the film industry is nothing if not a business of outliers.
Notes
Today’s research is looking at live-action movies released in UK cinemas between 2000 and 2021, for which there was available exit polling data.
Genre is determined by IMDb’s criteria, which allows a film to have multiple genres. Across the dataset, the average film had just over 2.5 genres.
Gender was determined by pronouns in biographies, online classifications (e.g. some movie databases spit ‘actors’ and ‘actresses’) and my past work on gender. I have split the gender stats into two categories as this reflects the way data has been captured over the period I studied. In the future, there may more nuanced databases which capture gender fluidity and non-binary identities, but until then we’re left with a rather crude binary approach. I used the gender the person currently publicly identifies as. I am always looking for better and more detailed ways to study and report on gender. If you think I can do better, reach out and we can chat.


Comments
Excellent study, as ever. Have you not had any publishers approach you to get this information into print form?
Thanks, Terry. The situation is better suited to online work as it needs constant updating.
Could there be any correlation linked to (genre as in: kind) of films?
I clarify: men could tend to write, direct and perform more “men-oriented” movie genres: sci-fi, action, crime, thriller (on the adrenalinic/testosteronic side of the spectrum), women could tend to write, direct and perform more “women-oriented” movie genres: comedy, family, romance and musical (on the romantic side pf the spectrum). So the bias may not be just the presence of men or women in the creative crew but ore in the kind of movie that is produced. I’m obviously oversimplifying but trying to understand the data pattern.
Absolutely. This is just showing correlation, not causation. There’s no doubt a strong link between the films people choose to make and who they are.
Of course that is probably the case but most male writer of articles these days are terrified and shaking at the thought of conveying info about the genders that supports biological differences or that males have a greater strength than females in any area. Unfortunately, this writer as many male writers have a cognitive bias as they are desperately trying to save and protect mommy at an unconscious level which is reflected in the way they frame statistics. I would just take any statistical comparison between men and women with a grain of salt these days. Many males are becoming increasingly ashamed of their gender and advocating for feminists. These are the most bizarre and delusional of times.
Hi Chris. Thank you for sharing your point of view. It’s a shame that you regard consideration as a weakness and are confused by kindness.
The data paints its own picture, and I have tried to be as light touch as possible in adding my own framing. Everyone is free to read the stats how they choose and to draw their own inferences from them. The fact that they have taken you to a place of fear and confusion is perhaps more a reflection of yourself than of the underlying situation the article is studying.
You are correct, the data speaks for itself. The one who accused you of bias, is the one who is biased. I was telling a woman about the econometric model I did in college to determine the demand for gasoline. It had an adjusted R square of .994. Her response was, I don’t believe any statistics because I know how statistics are manipulated. She never saw the study and concluded that. Like your study, I entered the data into a multiple regression of 9 independent variables and one dependent, which was gasoline consumption. One run with SPSS and I got that output. No need to manipulate anything. To this day, if you plug the actual numbers into the equation, it predicts to within the .994.
Thanks again for a cool study, Stephen! Keep up the good work.
Noticed a little error: it says ‘actors’ in the left axis where it should say ‘producers’. (Or do I see it wrong?)
Unfortunately, the data does not necessarily come to those conclusions you made. It is just as equally true that women tend to make X genre and X genre resonates more with women than men. A far better breakdown would be to examine the audience makeup of romance movies by the gender of the writer/producer. That way you can separate out genre preferences and so only have one variable at play instead of two.
That is a superb point! I have updated the article to take this on. Thank you for the suggestion!
This post doesn’t really answer the titular question. The research methodology here is flawed.
We only have percentages that communicate gender splits. Comparison between genres is therefore useless because it fails to take into consideration the relative popularity (or lack thereof) of particular genres and particular films. We don’t know what genres audiences gravitate towards, either in aggregate or split by gender. Therefore, we have very little to go on in terms of women’s preferences.
Based on the question posed, we are trying to determine whether a woman, upon finding out the gender of a film’s creative team, decides to view the film. I appreciate your inclusion of the graphs in the “Effect of Women Creatives” section, but you would also need to compare the size of audiences by genre, split by whether the film has women creatives.
I’ll give an example to hopefully make this clearer. Let’s compare two sci-fi films (A and B). Film A has a woman director; Film B does not. To answer the titular question, we would need to find out a few things. We need the gender split of both films. We also need the audience size of both films. Then, we can start making inferences as to whether it’s women specifically choosing Film A or whether it’s men rejecting Film A. Even then, we might not be able to make inferences. We would need to know the motivations for watching these sci-fi films. We can’t assume that a specific genre’s audience would carry over across films. Of course, that can be accounted for with a large film dataset, but still. My point is that this post oversimplifies the question to the point that it cannot be answered with the data provided.
At any rate, I do appreciate this post. If nothing else, it got me thinking about research methodologies and the pitfalls people (including myself) can run into when trying to answer deceptively simple questions.
Hey Roosevelt. Thanks for your comment. It’s certainly true that we’re looking at correlation rather than causation. As you say, I think there’s still merit in the patterns.
Nothing in our industry happens in a vacuum and we don’t get to test specific factors independent of everything else. Similarly, when people are making decisions in the filmmaking process they are not about to adjust each independent variable. As in, no-one hires “a women director” but rather they meet human beings who have so many more attributes about them. As a result, conducting a perfect experiment to assess the effect of gender in its purest sense may not be feasible or necessarily more useful than the generalised correlations we see above.
I’m not sure that audience size is relevant here as we’re looking at the gender split, and so the raw number of people wouldn’t matter.
Thank you so much — this is extremely enlightening and goes to show studios need women behind the scenes if they expect to attract female audiences. Have you spoken with Naomi McDougall Jones about the data she shared in women in Hollywood in her book?