 According to news reports, Netflix boss Ted Sarandos has privately been telling producers that his company will be more cost-conscious going forward.
This comes on the heels of Netflix’s Triple Frontier (a movie which reportedly cost $115 million but which has gone down poorly with audiences and critics alike) and their up-coming blockbuster Red Notice (which is likely to cost upwards of $200 million, including unusually large pay-cheques for its stars, The Rock, Gal Gadot and Ryan Reynolds).
Netflix’s journey towards bigger and bigger budgets, only to then start lowering them again, is a story Hollywood knows well. Over the past century, most of the major studios have had moments of budget inflation and belt-tightening.
Last week, I shared my research into how much the average movie has cost to make over the past five years and so this week I want to turn to look at how average budgets have changed over the past twenty years.
I built up a dataset of 5,713 feature films released domestically (i.e. in US & Canadian cinemas) for which I could find a public budget figure. See the Notes section for details and caveats of budget information.
For readability, I’m going to write as if all the budget figures stated below are pure fact. In reality, some will be over- or under-estimates and almost all publicly available figures have murky provenance. So for the rest of today’s article please imagine I have added “reportedly” ahead of any statement of budget figures.
Hollywood mean business
Let’s start with the simplest, crudest way of tracking the change in budget levels – the arithmetic mean. This is the average budget figure for all movies released domestically in a given year.
As the chart below shows, there has been a steady decline between the early 2000s and the mid-2010s, after which point the average budget has been rising sharply.
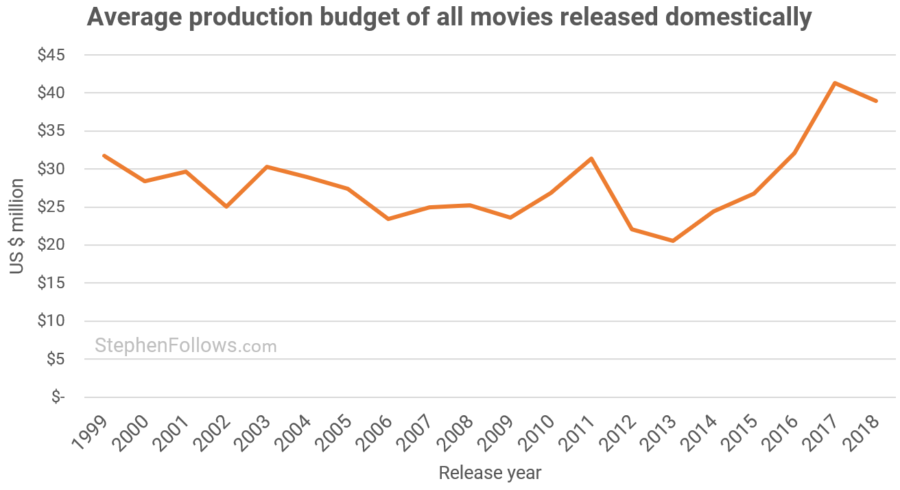
Despite the attractive simplicity of this figure, it isn’t very useful. It hides the differences between types of films and doesn’t reveal why the average is changing as it is. So let’s take two different ways of subdividing the data – by genre and by budget level.
The winners and losers
As we saw last week, budgets differ significantly between genres. I don’t have space to discuss each genre individually and so I have picked out four which illustrate different parts of the story.
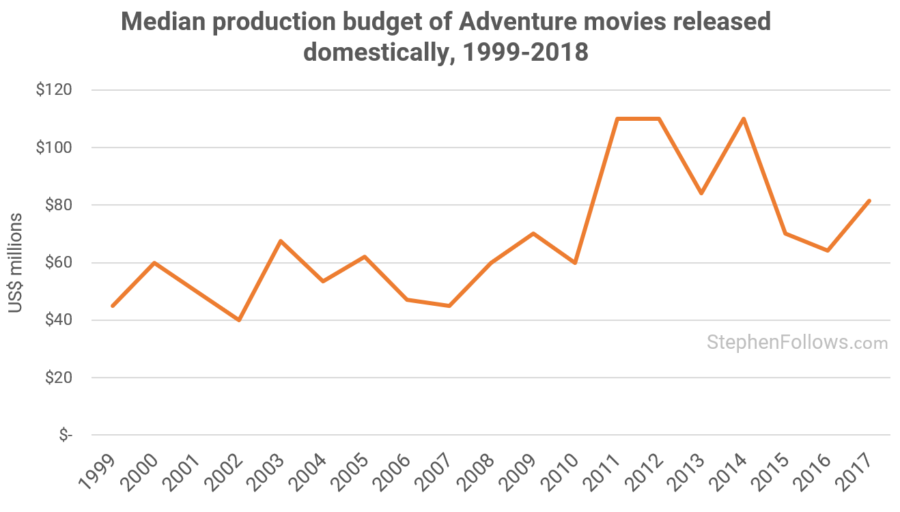
Over the past five years, the median budget for Adventure films was $76m – over four times the overall median of $18m. Not only is Adventure the genre with the largest median budget but it’s also the one that has been increasing the fastest. Median budgets more than doubled between 2007 ($45m) and 2011 ($110m).
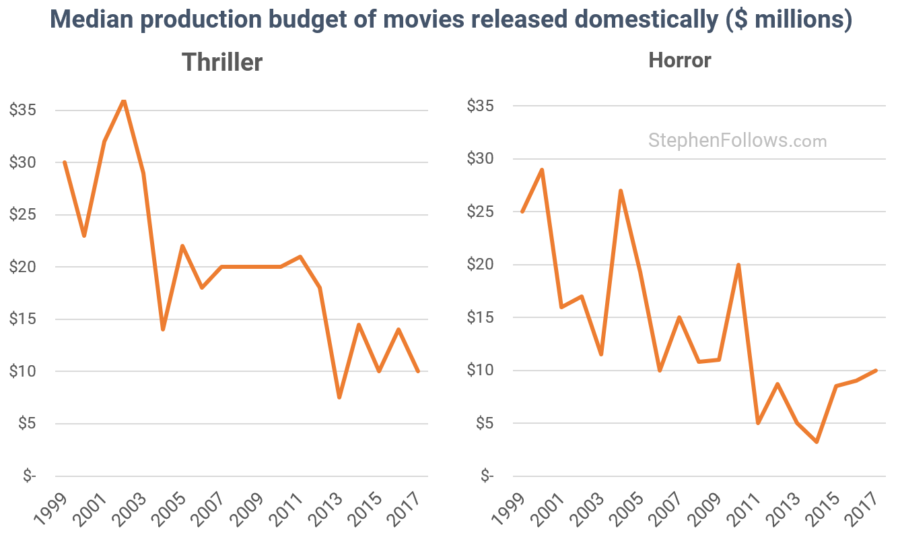
At the other end of the spectrum are Thrillers and Horror movies, which have shown the biggest twenty-year decline.
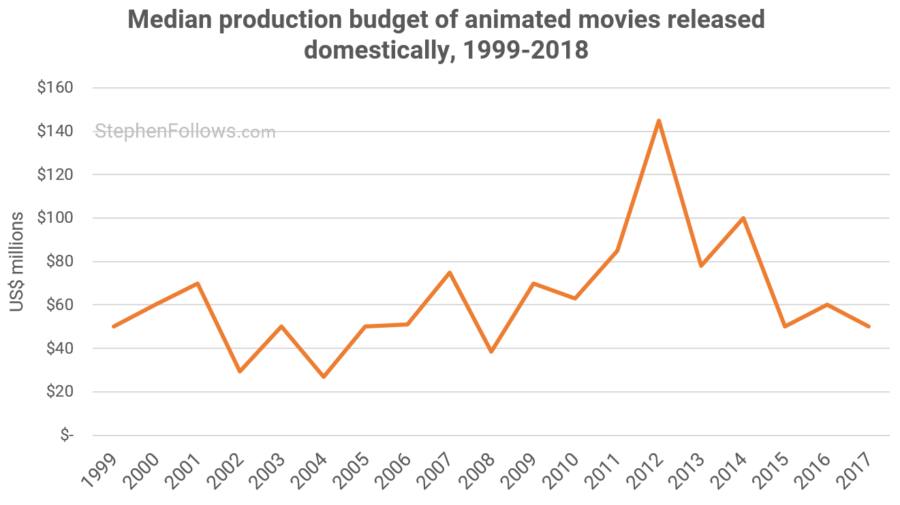
Another type of film I want to look at quickly is animation. As you can see below, there was a huge inflation of animation budgets in the early 2010s.
This may partly be explained by studios over-confidently over-paying for a rash of sequels, including Cars 2, Monsters University, Kung Fu Panda 2, Madagascar 3 and Happy Feet Two.
Which budget ranges have been increasing?
The chart below splits all movie releases into one of eight budget categories, revealing which budget ranges are more/less common.
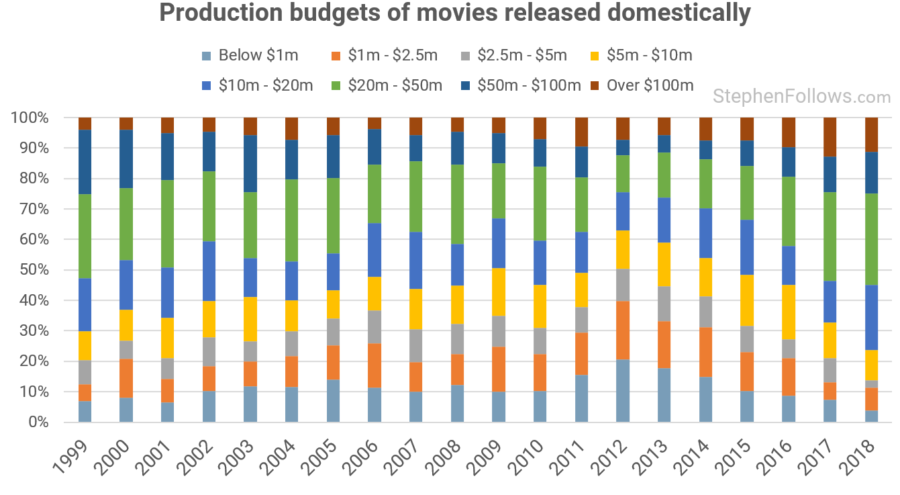
It can be hard to see what’s going on, and so I have picked out three budget ranges we can look at individually.
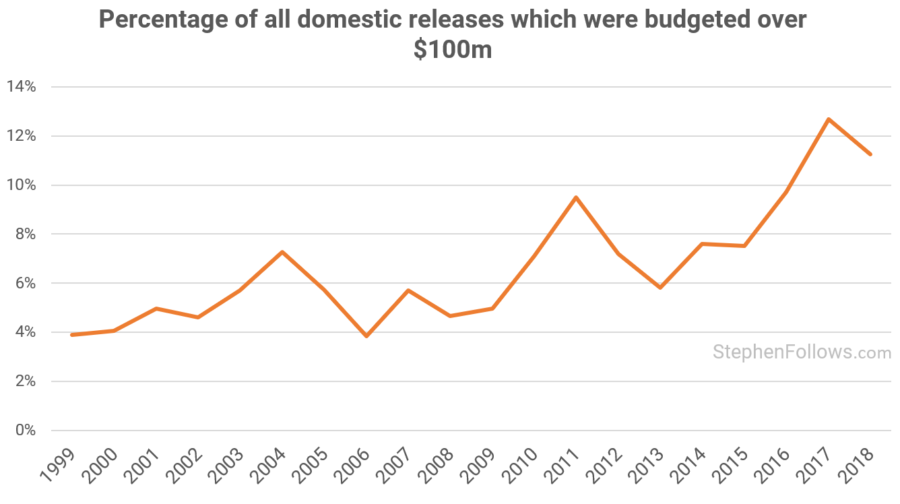
The fastest growing scale of movie over the past decade has been those costing over $100 million. At the turn of the millennium, they accounted for around 4% of movies released domestically (for which budgets are available) but by 2017 this had ballooned to over 12%.
Whilst the biggest movies have been growing, there has been a decline in “mid-budget” movies. The chart below shows the rapid decline in movies costing between $50m and $100m over the past two decades, rallying in recent years.
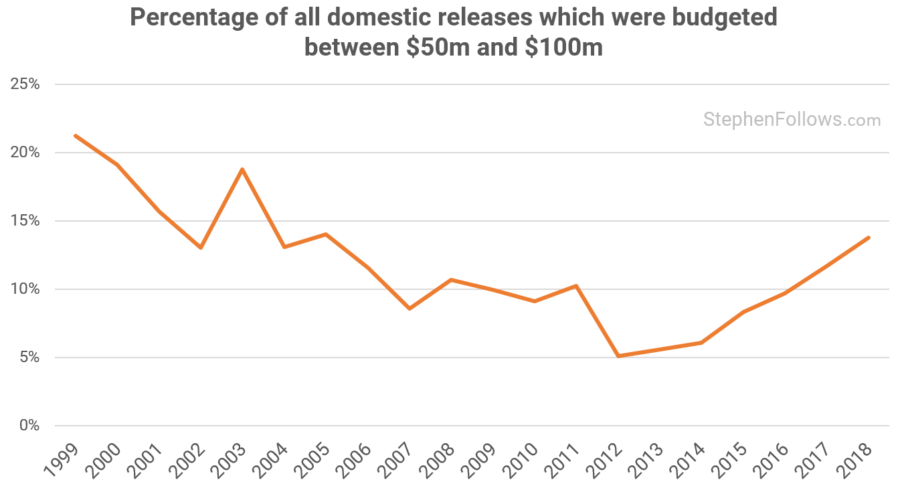
This is a trend which Hollywood studios have been struggling to know how to adjust to and which the press has been unable to cover coherently (variously describing such as movies as “an endangered species“, “struggling“, having a “quiet return” and 2018 being both the “death and return” of such movies). There’s no doubt that the loss of the VHS rental and DVD retail markets have hit these types of movies hard and led to the abundance of big-budget franchises we see in multiplexes today.
Fewer low/no-budget movies (i.e. under $1 million) have been reaching US cinemas recently, both in terms of market share and in raw numbers. In 2012, over one in five films released domestically cost under $1m, whereas in 2018 that fell to fewer than one in twenty. 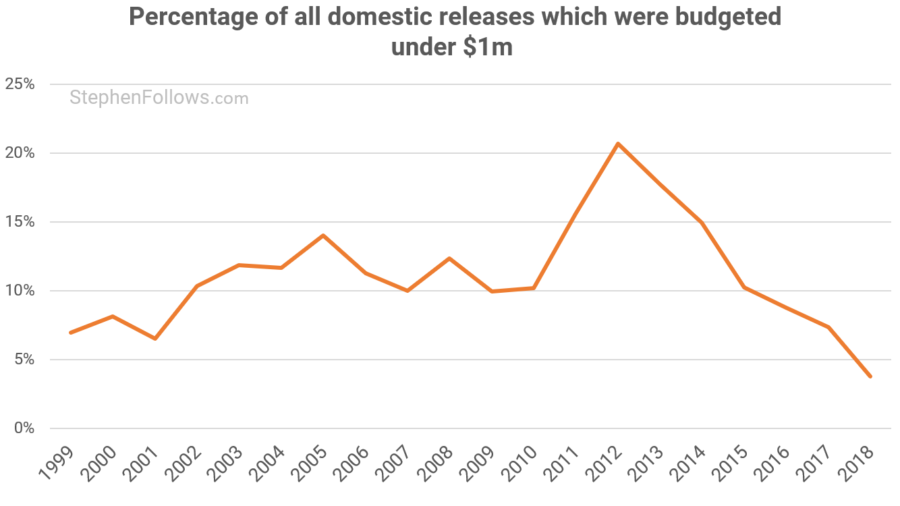
Some of this decline may be partly explained by a delay in reporting lower budget films (see Notes section for more on this) but it seems unlikely to explain the majority of this trend.
Further reading
 If you want to read more about budgets then you may enjoy these past articles:
- How do film budgets change as they grow?
- Do filmmakers lie about their budgets?
- Has the mid-budget drama disappeared?
- What’s the average budget of a low or micro-budget film?
- What is the average UK film budget?
Today we have been looking at production budgets, rather than the additional costs involved with releasing and marketing a movie. If you want to learn about how much more is spent by studios once the movie is finished then you may enjoy these articles: How movies make money: $100m+ Hollywood blockbusters and How films make money pt2: $30m-$100m movies.
Notes
The data for today’s research came from the OpusData / The Numbers, IMDb, Wikipedia, Box Office Mojo and the film trade press. I manually fixed any suspect figures I found, such as the Chinese war epic which IMDb claims cost $18.
The publicly available figure should be regarded as a rough ballpark, rather than a precise number for a bunch of reasons. We can’t trace the original source of the figure, we don’t know if they are including soft money/rebates, the filmmakers may not be telling the truth, etc. A while ago, I gained access to the full, real costs and income of 29 Hollywood movies budgeted over $100m and so was able to compare their true cost with the figure stated on Wikipedia. I found that on average these movies cost 12.5% more than their Wikipedia entry stated.
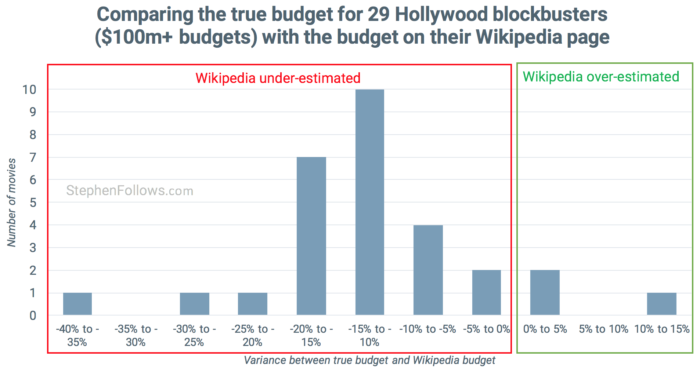
I don’t know if this pattern is reflected with lower budget movies.
It is difficult to know how many of the trends we’re seeing in the past couple of years are down to a reporting bias. It can take some time for budget figures to be released publicly, meaning that some of the films from 2018 for which we do not yet have budgets will eventually have a figure. If these were unevenly distributed (i.e. more like to be lower budgeted films) then this would depress the number of some budget ranges (i.e. such as showing a drop in lower-budgeted films). While there is likely to be a small amount of this at play, I do not think it’s significant, nor does it invalidate anything I have found today. Four years ago I studied this phenomenon in relation to a decline in micro-budget productions in the UK, which the BFI suggested was partially caused by delayed budget discovery. I tracked how long it had taken budgets to be discovered in previous years, to assess the scale of under-reporting. More on that here What’s happened to UK low-budget film production?
The genres come via IMDb, whereby films are permitted to have up to three genres. I appreciate that the IMDb genre model leaves a lot to be desired (i.e. over-classifying projects as ‘Drama’, stating ‘Animation’ as a genre rather than a production method, etc) but I fear that unpicking this will have to wait for a future research project!
These figures do not take into account inflation. A dollar in 1999 is the equivalent of $1.53 in 2019.



Comments
maybe mid-budget movies are coming back……
Good question. The business is often described as cyclical, perhaps you can investigate how true that is. Or, I suspect, more looking like a family tree from Netflix’ Dark?